Serving design decisions
Just as the use case determines appropriate training architecture, it’s also determines the appropriate serving architecture.
In designing our serving architecture, one of our goals is to minimize average latency.
Just like in operating systems, where we don’t want to be bottlenecked by slow disk I/O, when serving models, we don’t want to be bottlenecked by slow-to-decide models.
Remarkably, the solution for serving models is very similar to what we do to optimize I/O performance: we use a cache.
In this case, rather than faster memory, we’ll use a table.
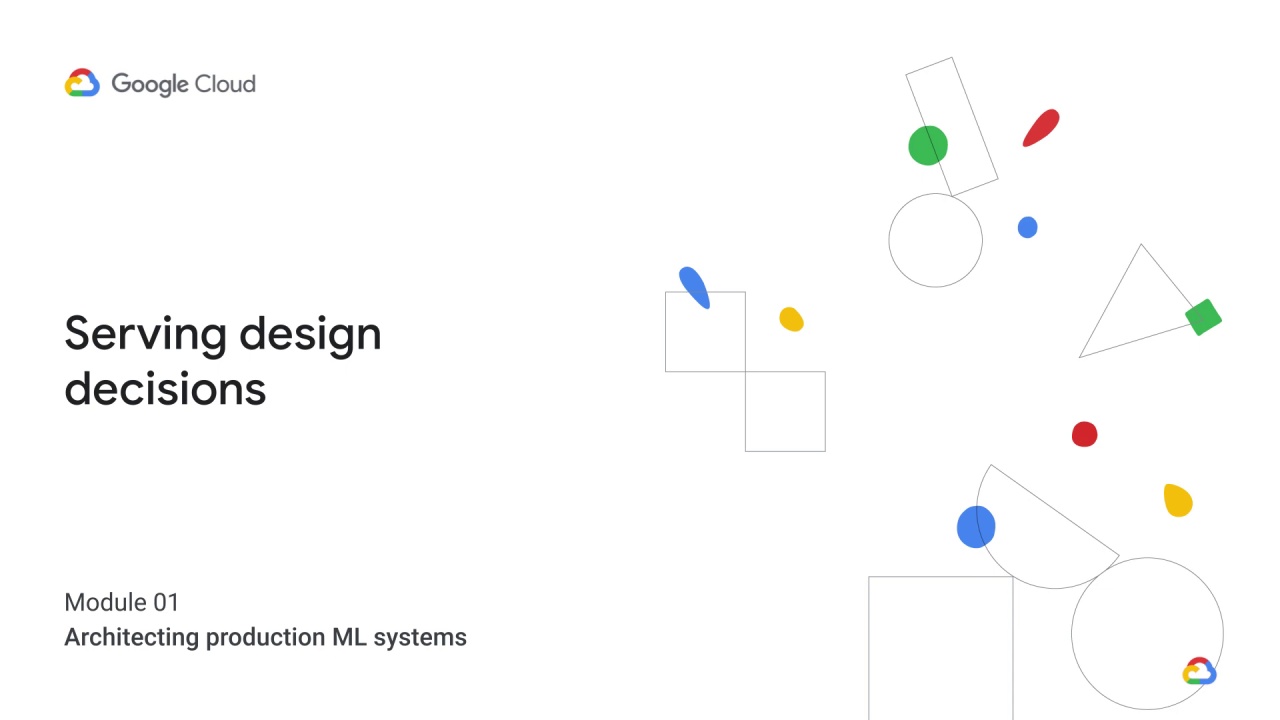
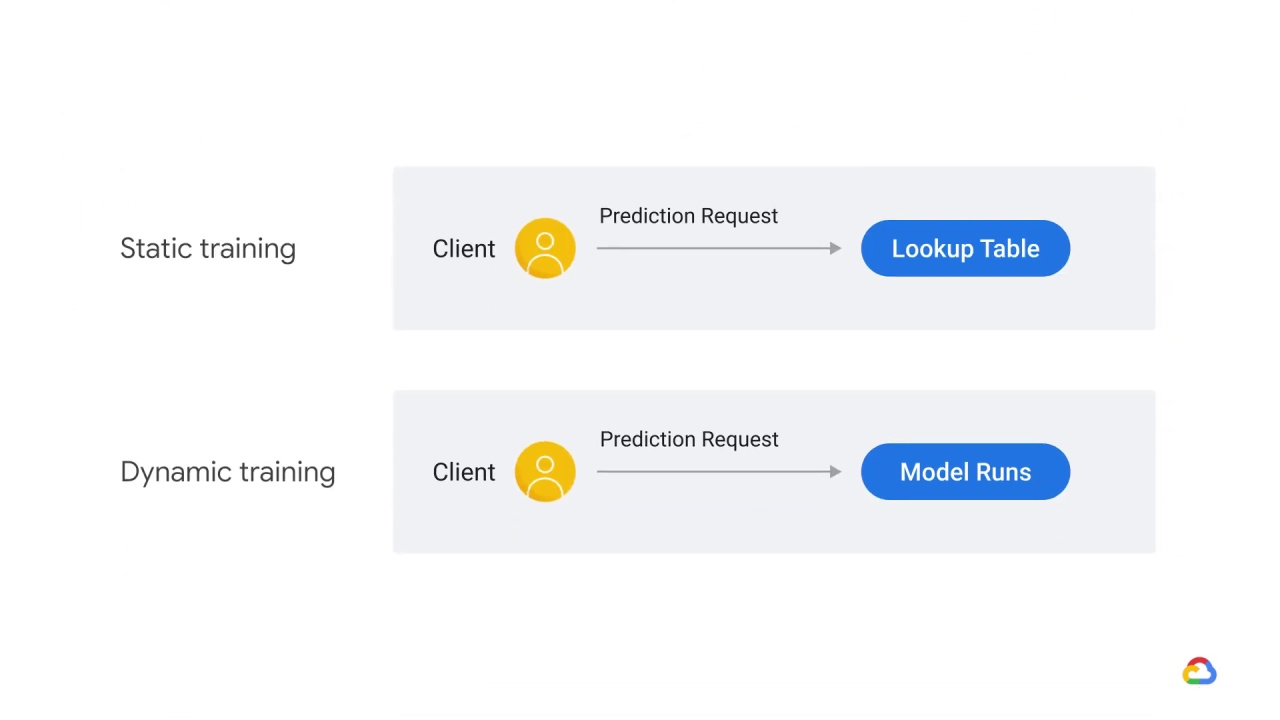
Static serving then computes the label ahead of time and serves by looking it up in the table.
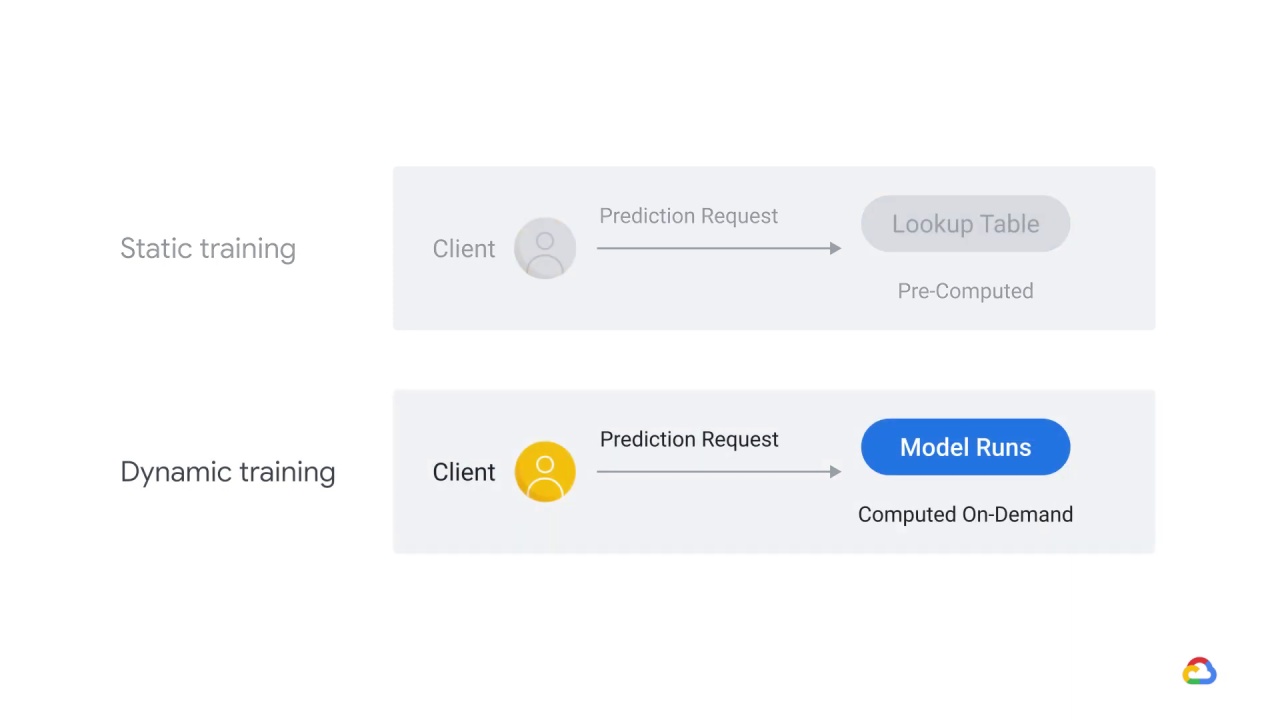
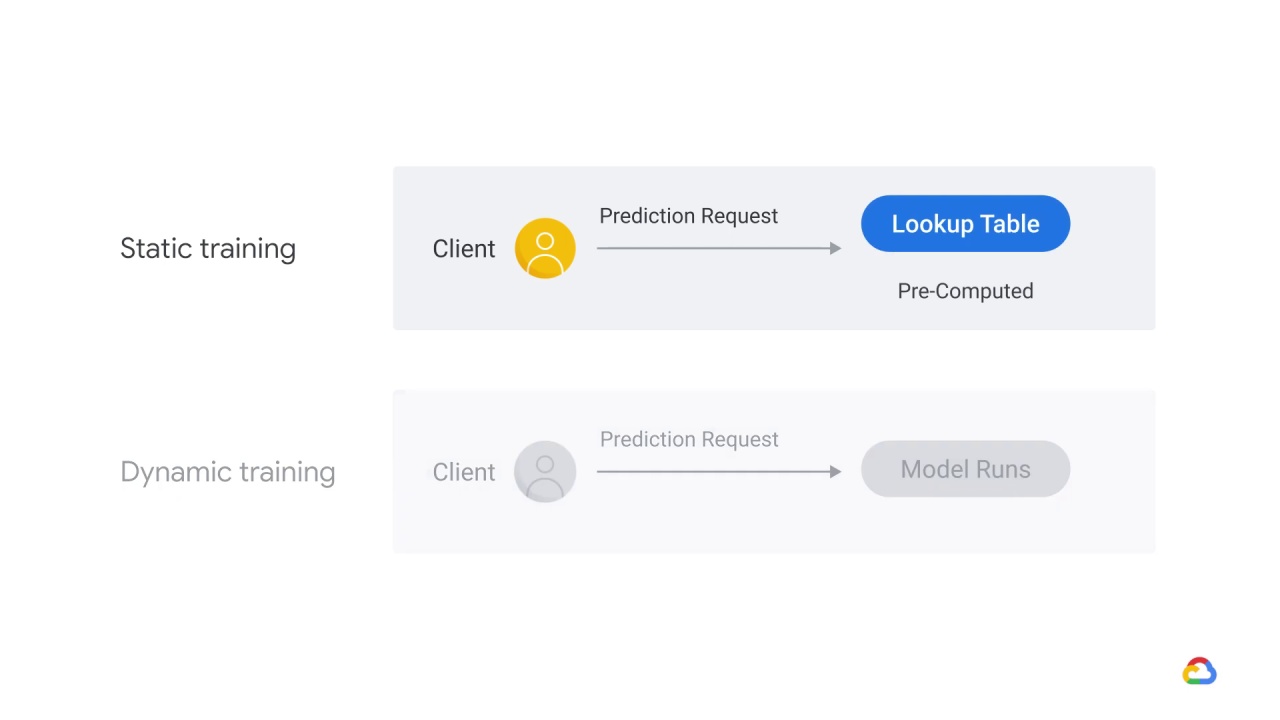
Dynamic serving, in contrast, computes the label on-demand.
There’s a space-time tradeoff.
Static serving is

space-intensive,
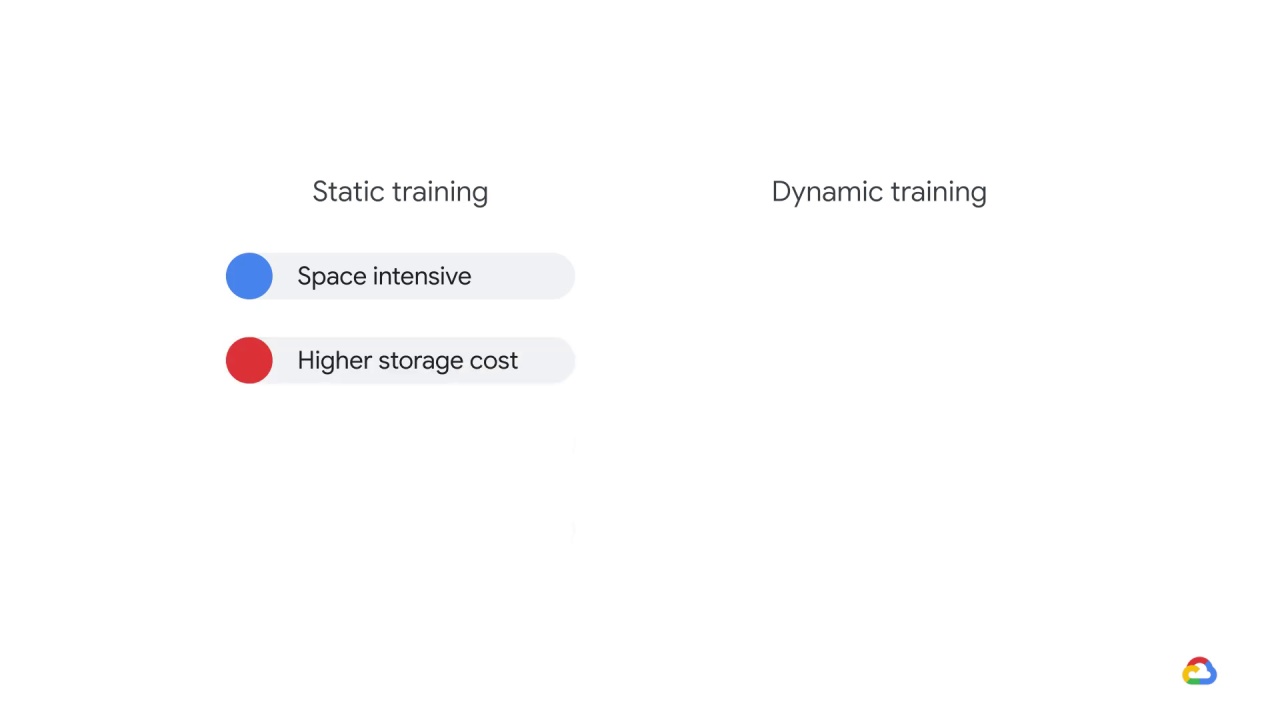
resulting in higher storage costs, because we store pre-computed predictions
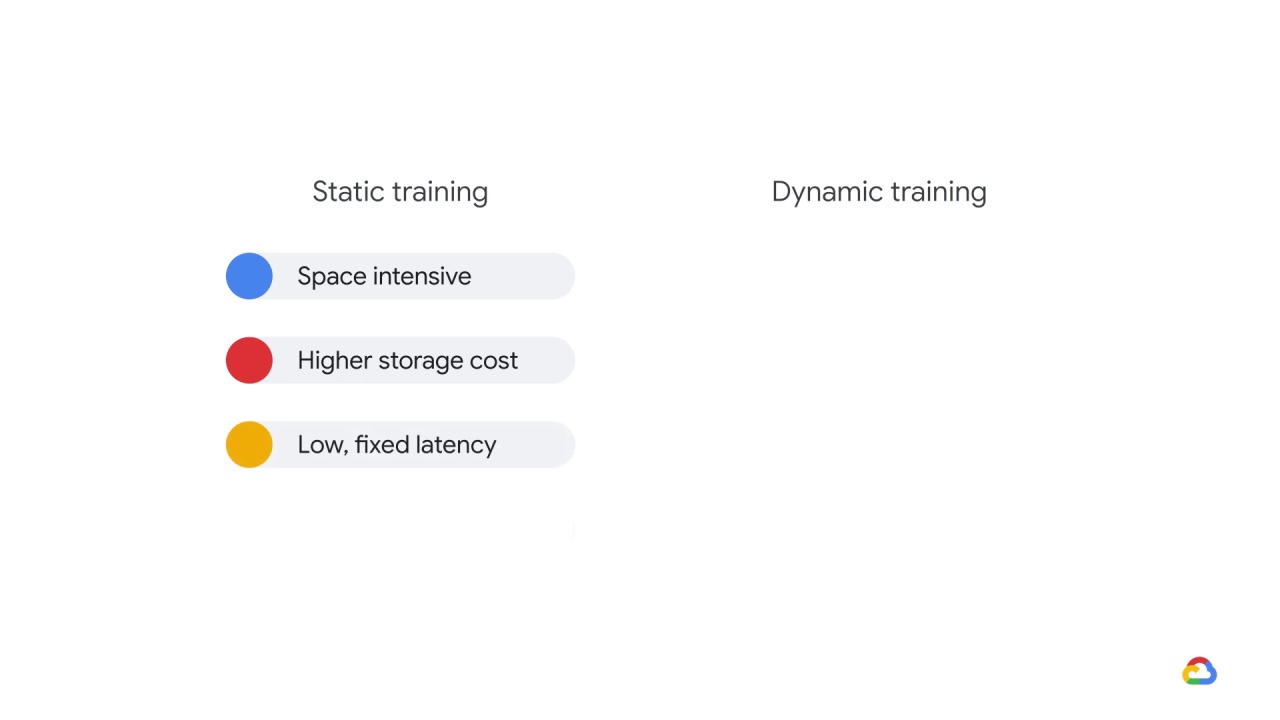
with a low, fixed latency
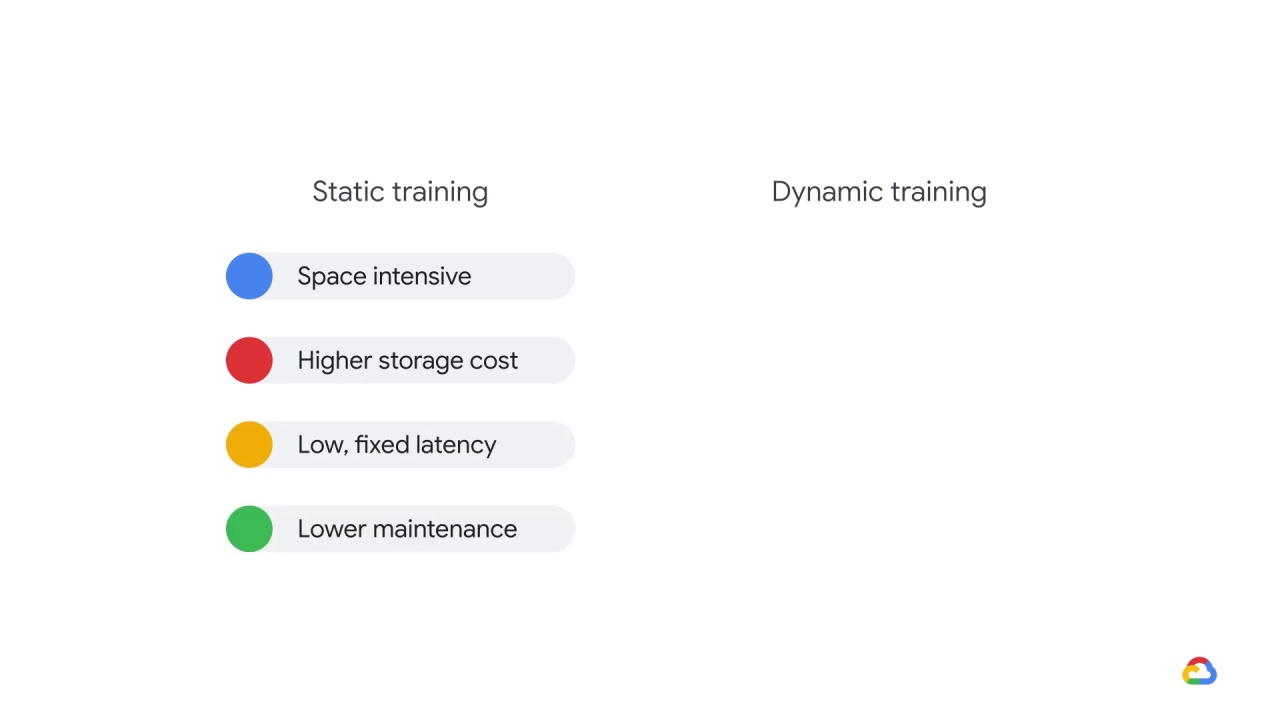
y and lower maintenance costs.
Dynamic serving, however, is
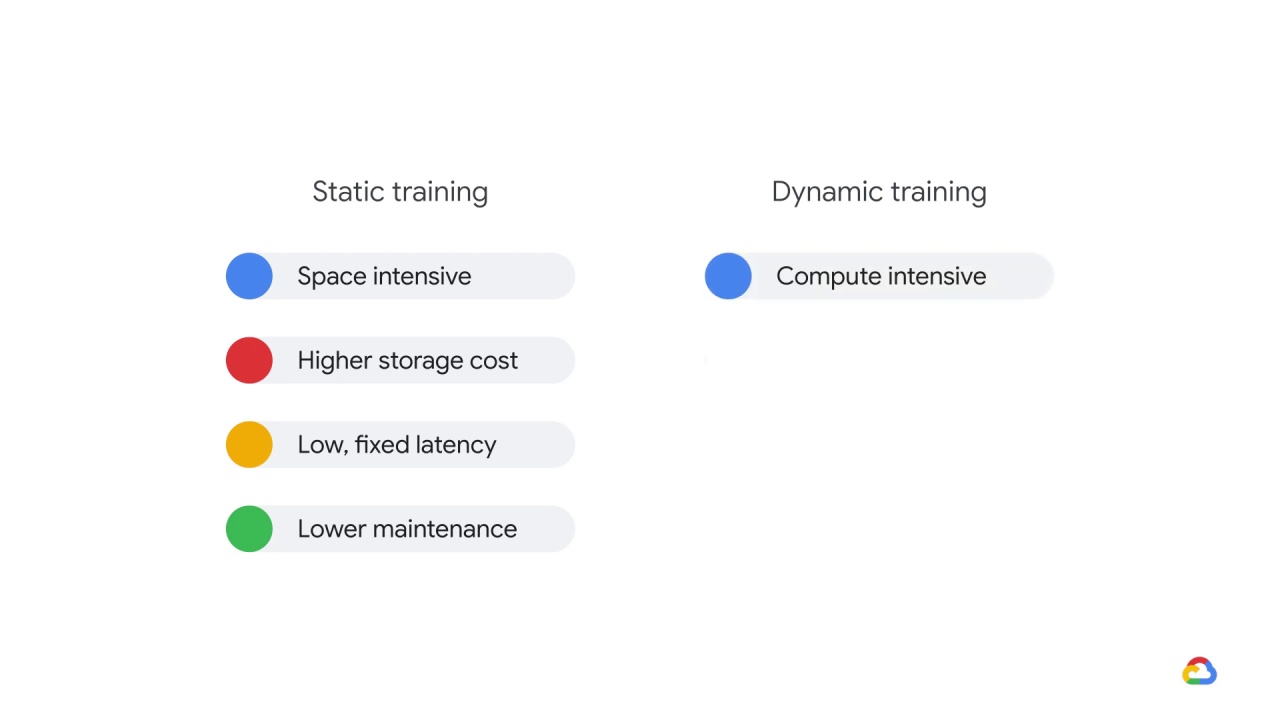
compute-intensive.
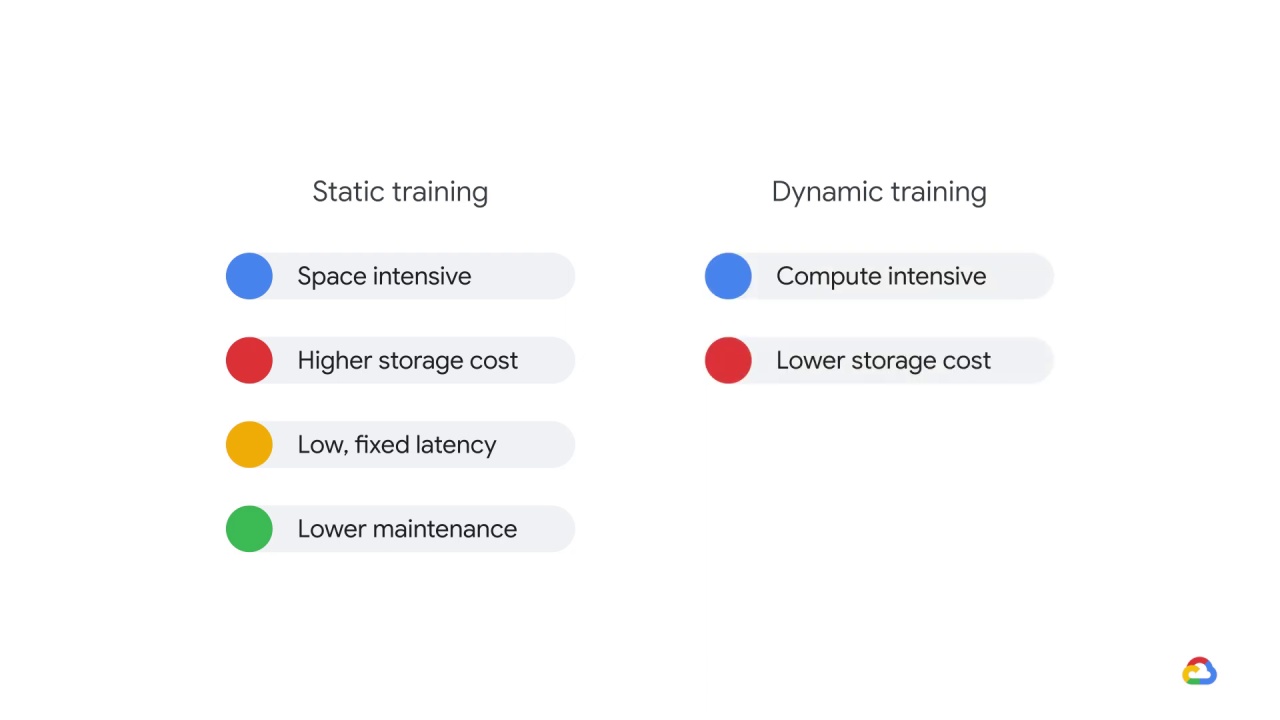
It has lower storage costs,
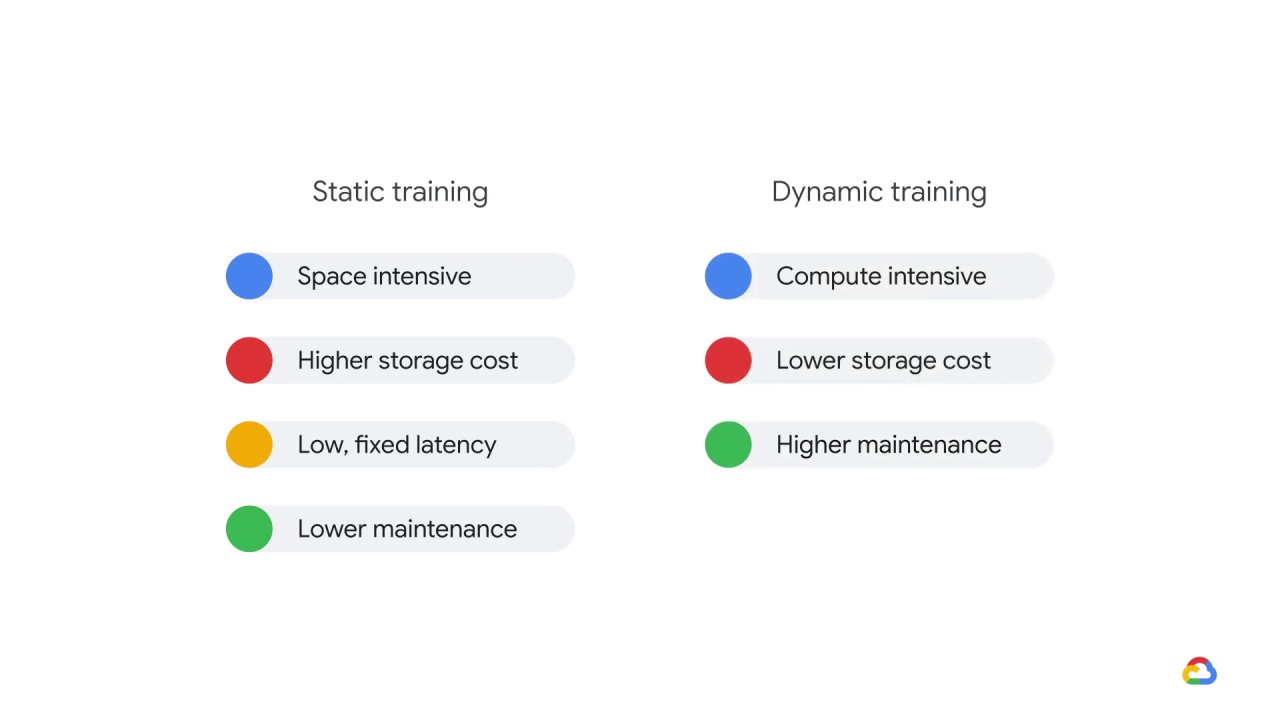
higher maintenance,
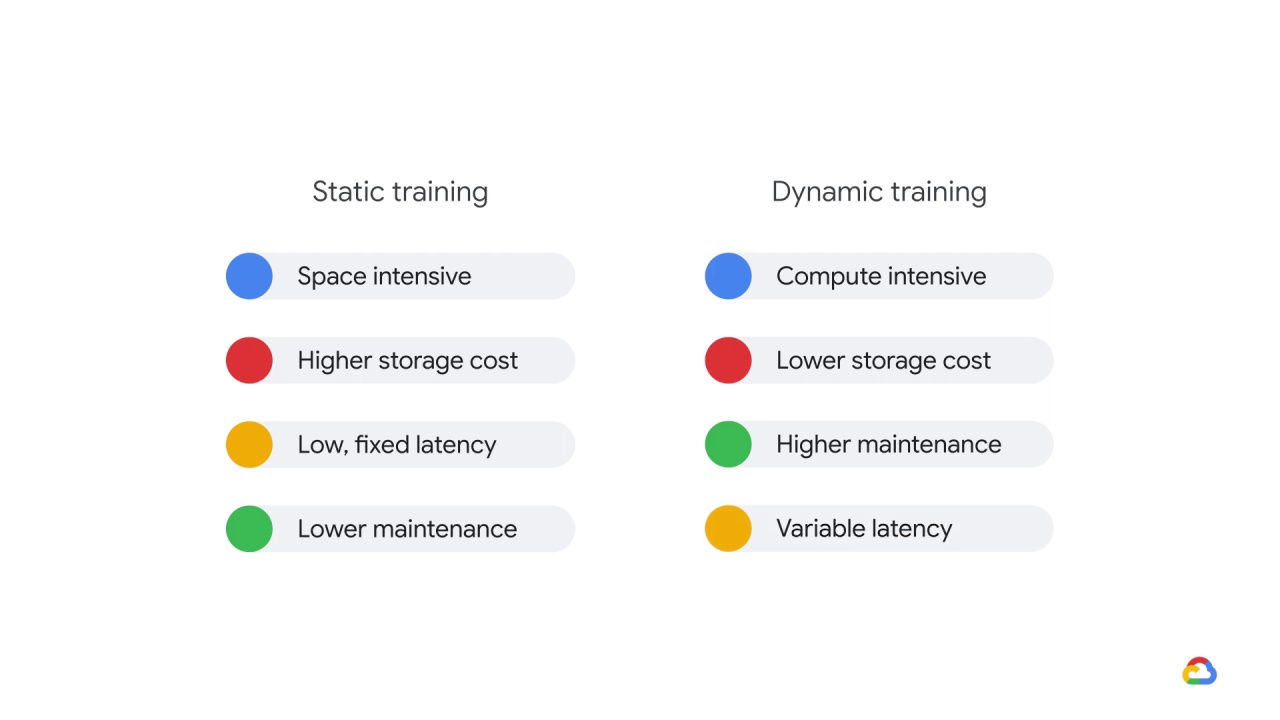
and variable latency.
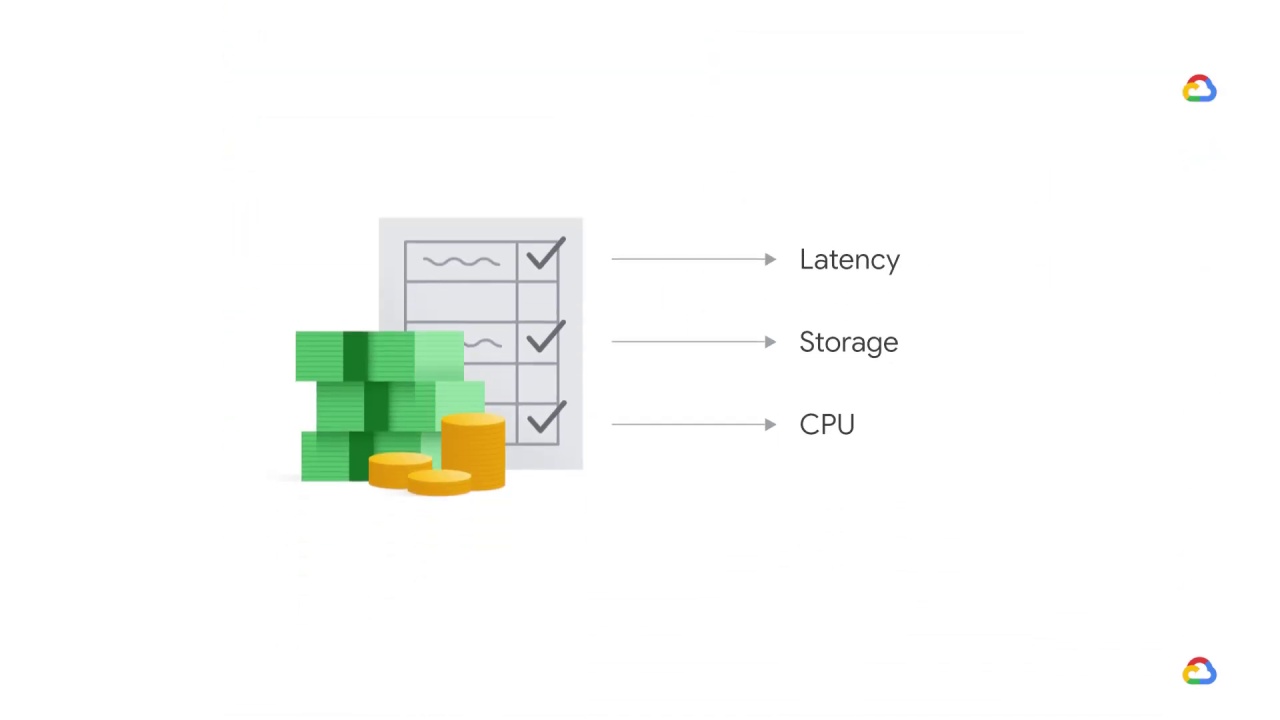
The choice whether to use static or dynamic serving is determined by considering how important latency, storage, and CPU costs are.

Sometimes, it can be hard to express the relative importance of these three areas.
As a result, it might be helpful to consider static and dynamic serving through another lens:

peakedness
cardinality
Peakedness in a data distribution is the degree to which data values are concentrated around the mean,
or in this case, how concentrated the distribution of the prediction workload is.
You can also think of it as inverse entropy.

For example, a model that predicts the next word given the current word, which you might find in your mobile phone keyboard app,
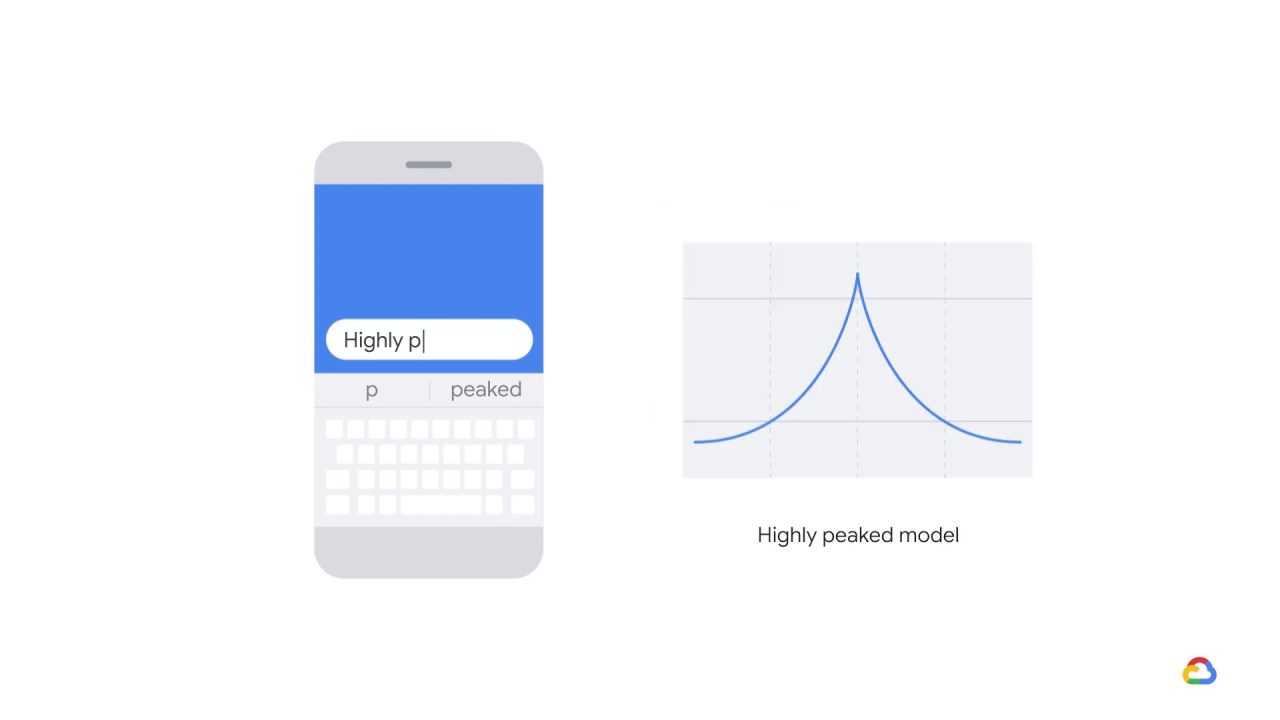
would be highly peaked
because a small number of words account for the majority of words used.

In contrast, a model that predicted quarterly revenue for all sales verticals in order to populate a report
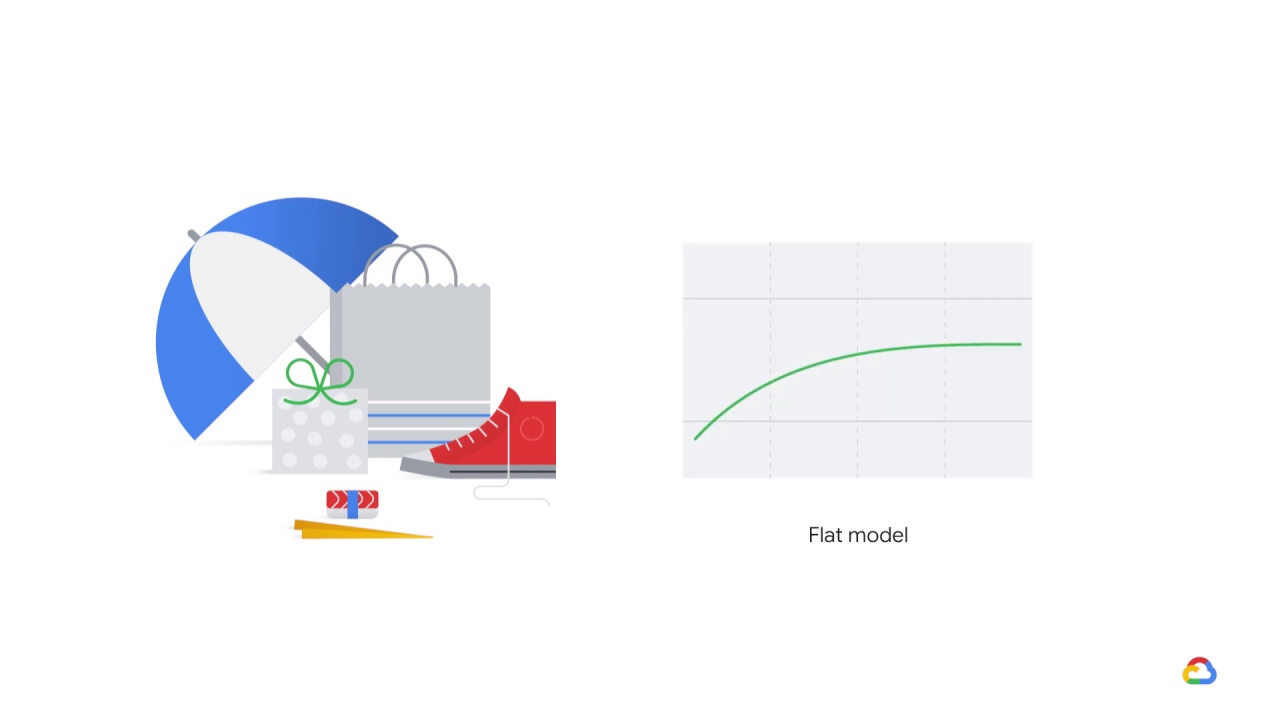
would be run on the same verticals, and with the same frequency for each, and so it would be very flat.
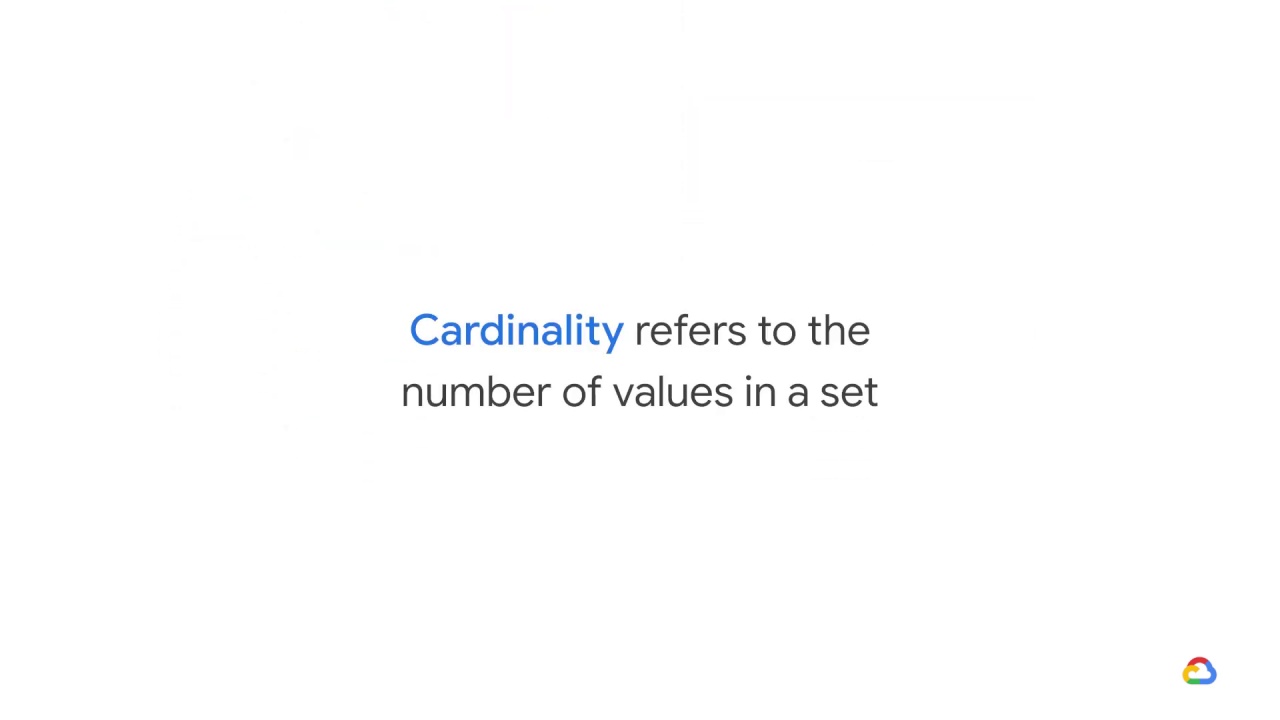
Cardinality refers to the number of values in a set.
In this case, the set is composed of all the possible things we might have to make predictions for.
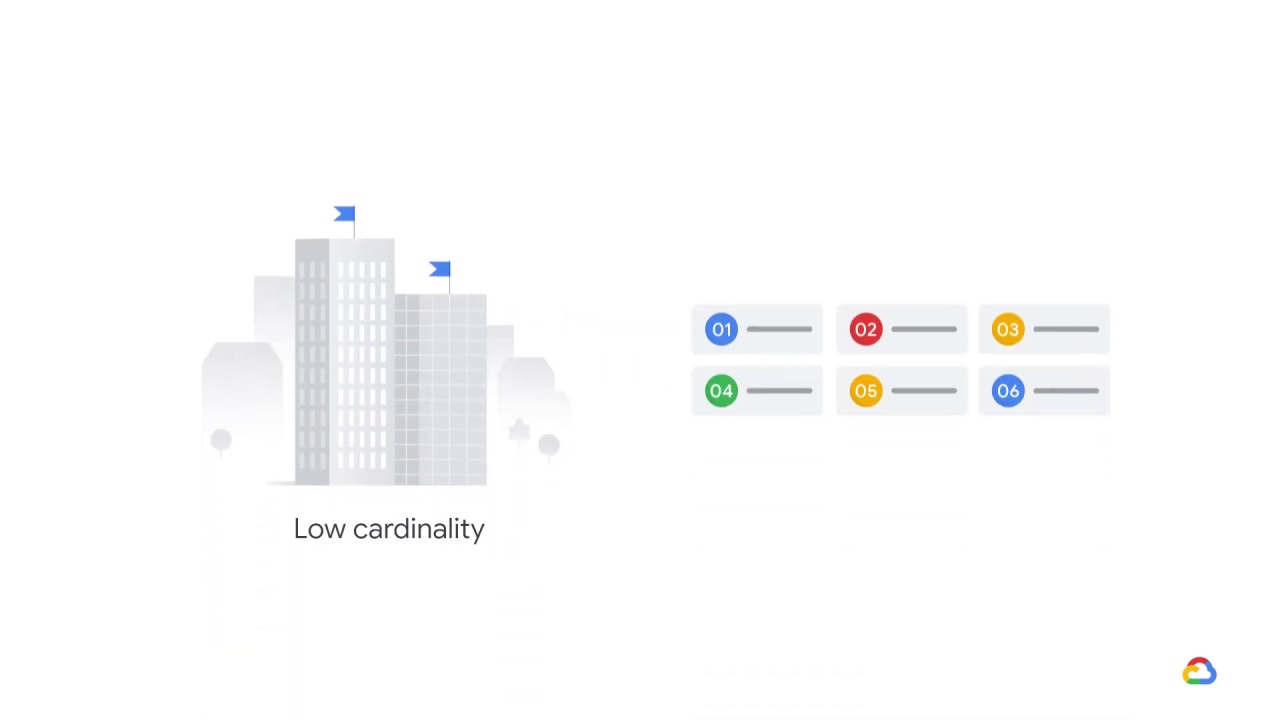
So, a model predicting sales revenue given organization division number would have fairly low cardinality.
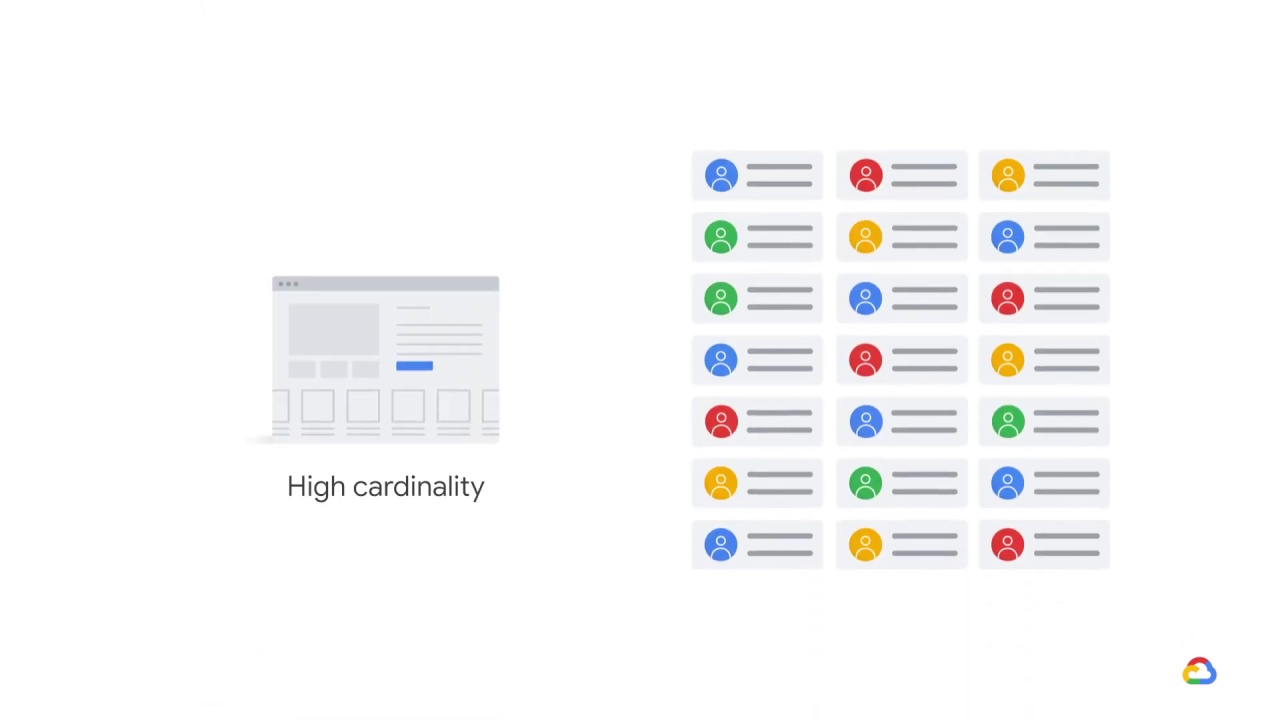
A model predicting lifetime value given a user for an ecommerce platform would be high cardinality because the number of users, and the number of characteristics of each user, are likely to be quite large.
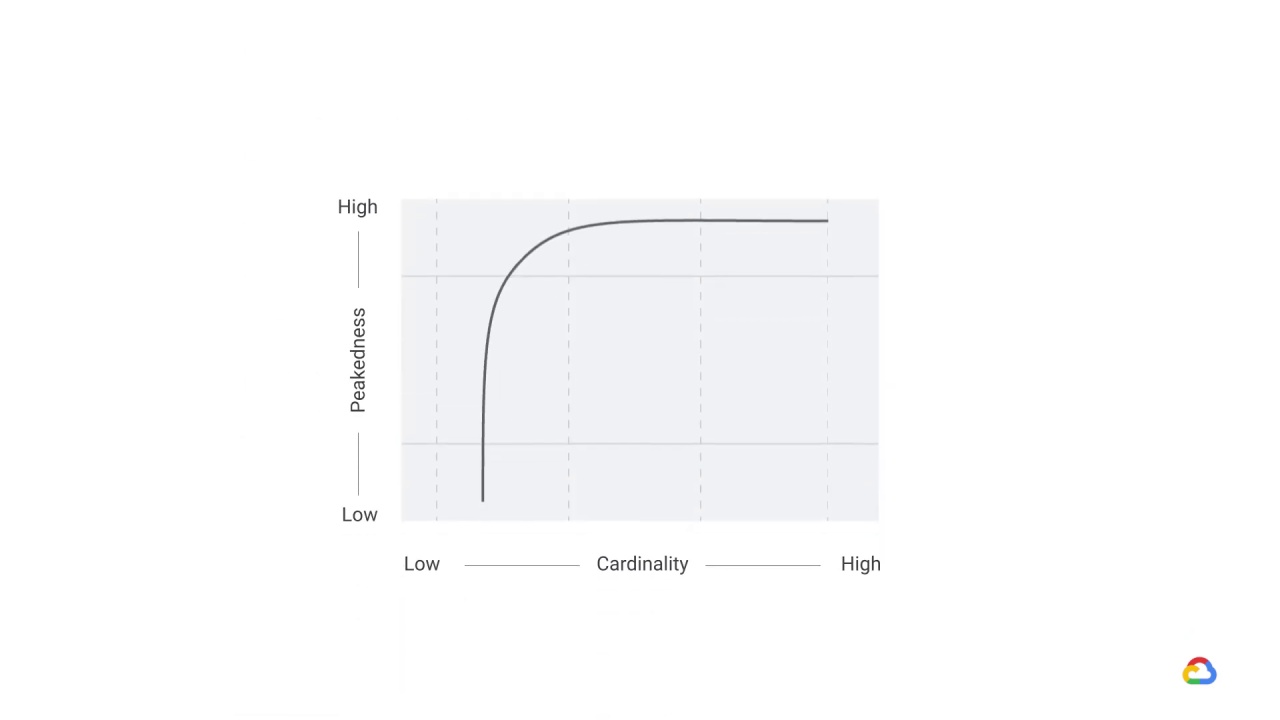
Taken together, peakedness and cardinality create a space.
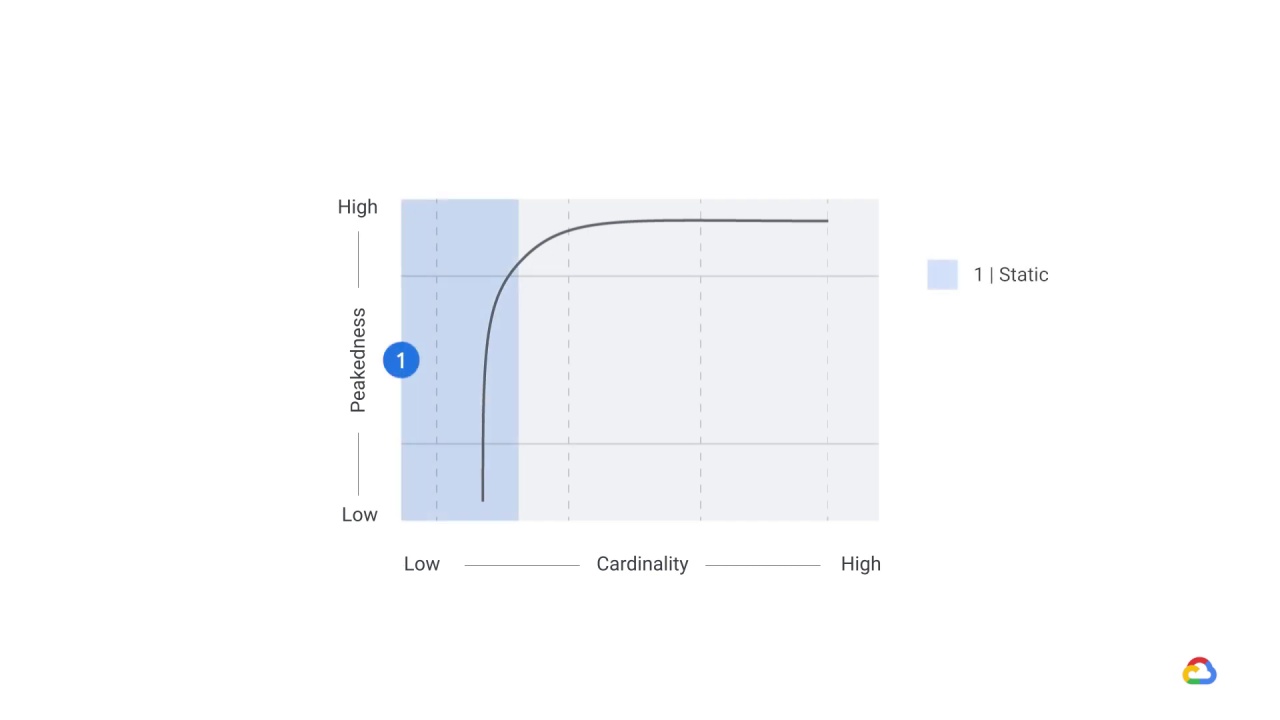
When the cardinality is sufficiently low, we can store the entire expected prediction workload, for example, the predicted sales revenue for all divisions, in a table and use static serving.
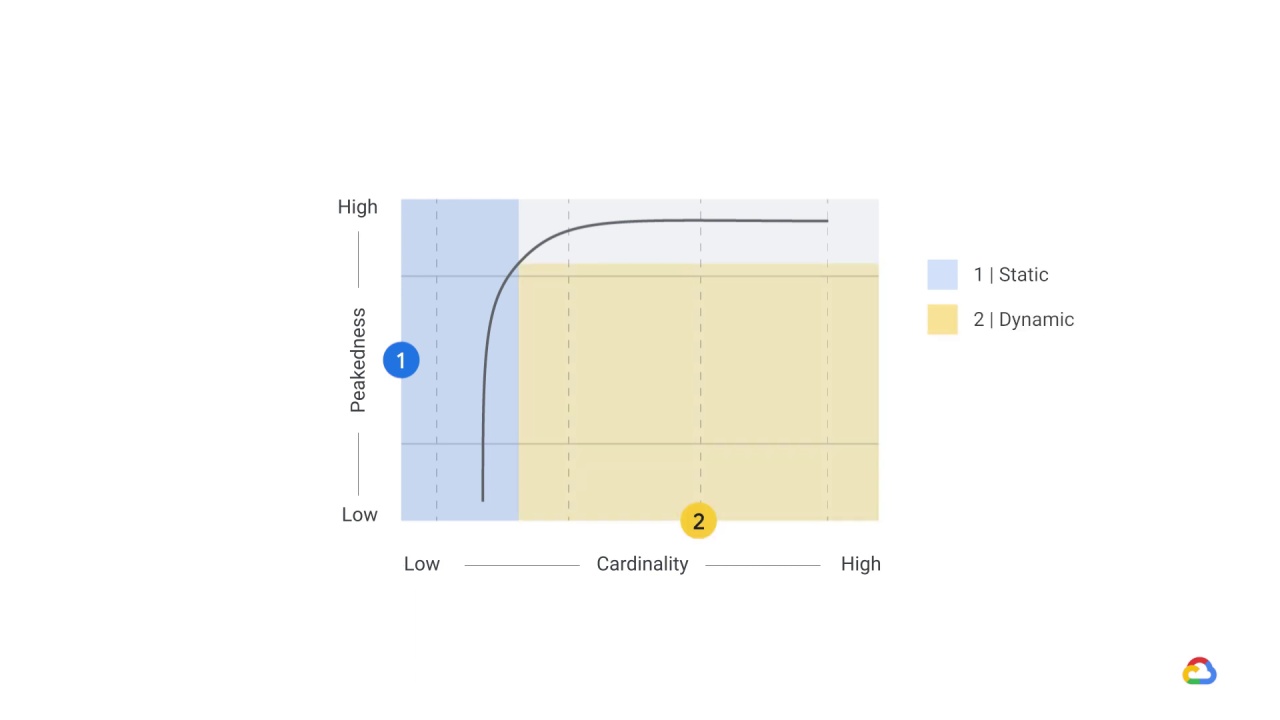
When the cardinality is high, because the size of the input space is large, and the workload is not very peaked, you probably want to use dynamic training.
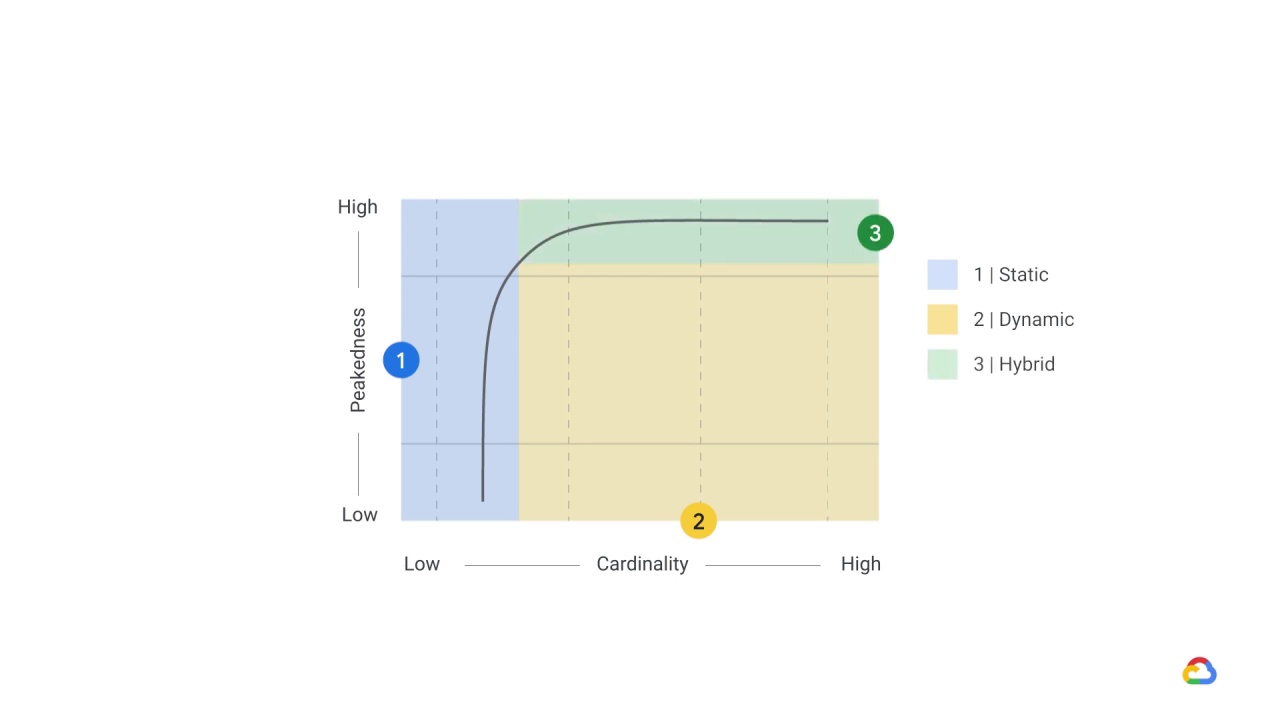
In practice, though, you often choose a hybrid of static and dynamic, where you statically cache some of the predictions while responding on-demand for the long tail.
This works best when the distribution is sufficiently peaked.
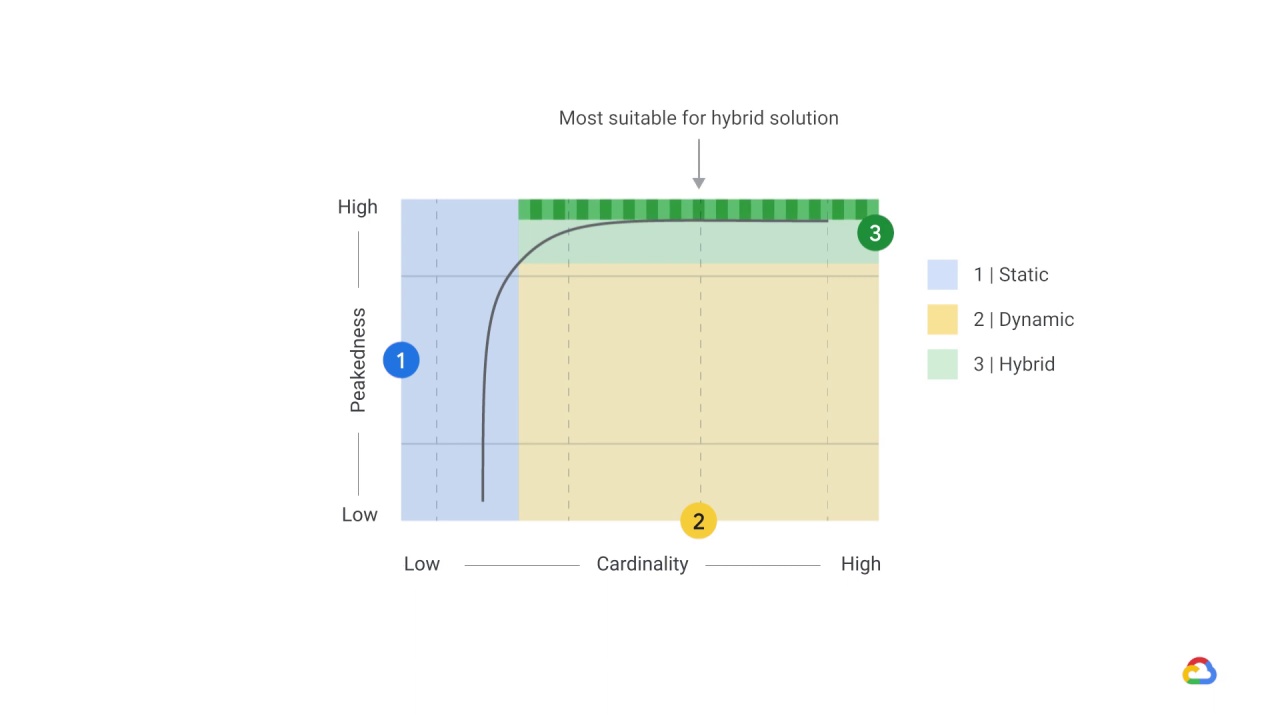
The striped area above the curve and not inside the blue rectangle is suitable for a hybrid solution, with the most frequently requested predictions cached and the tail computed on demand.
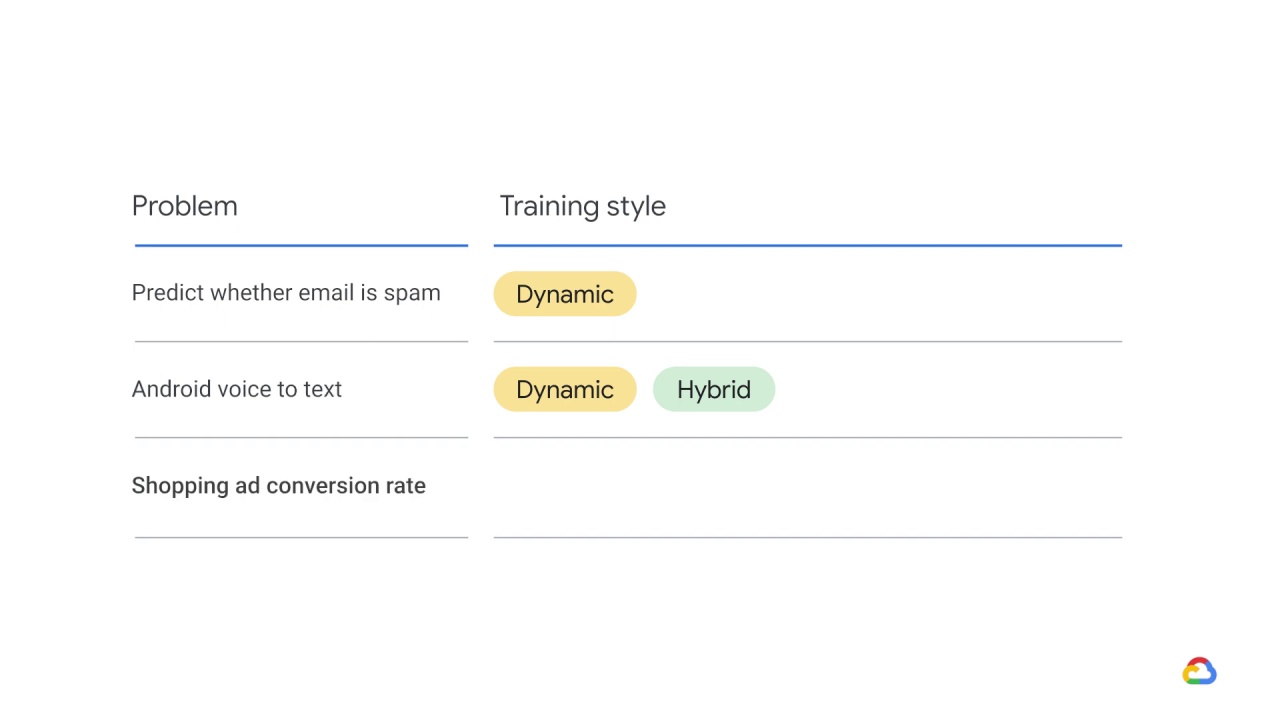
Let’s try to estimate training and inference needs for the same use cases that we saw in the previous lesson.
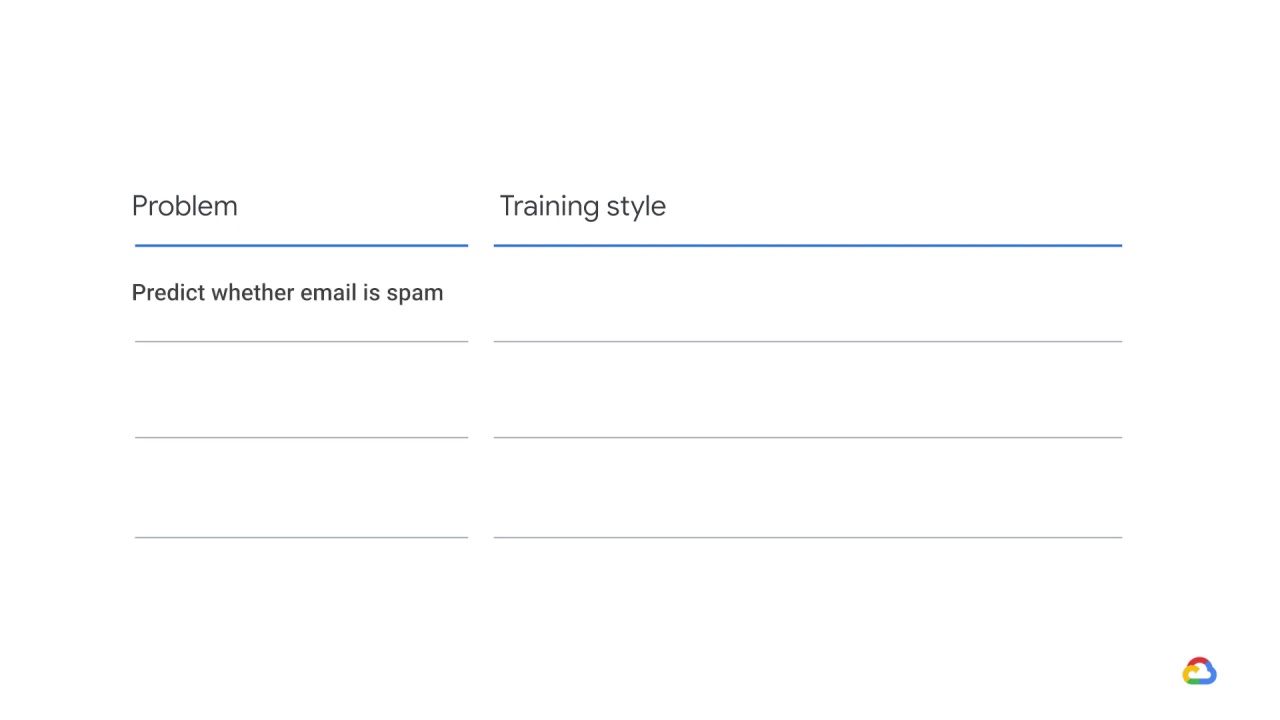
The first use case is predicting whether an email is spam.
What inference style is needed?
Well, first we need to consider how peaked the distribution is.
The answer is not at all; most emails are likely to be different, although they may be very similar if generated programmatically.
Depending on the choice of representation, the cardinality might be enormous.
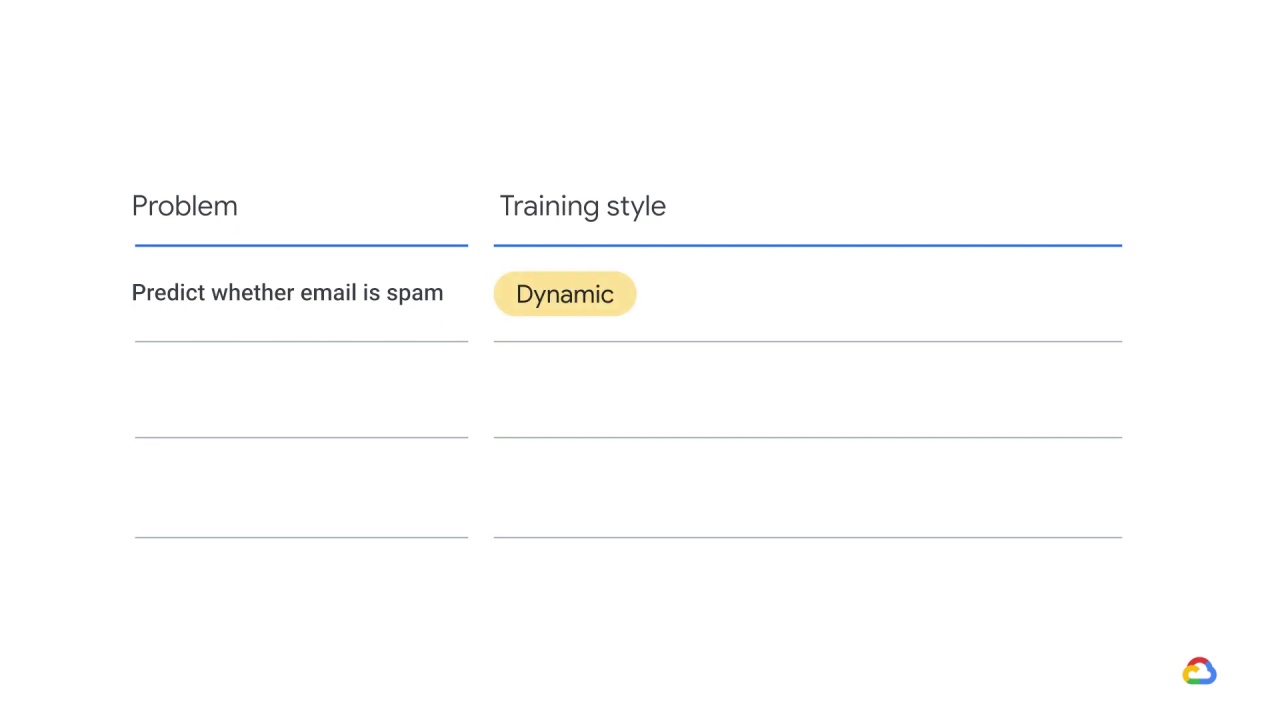
So, this would be dynamic.
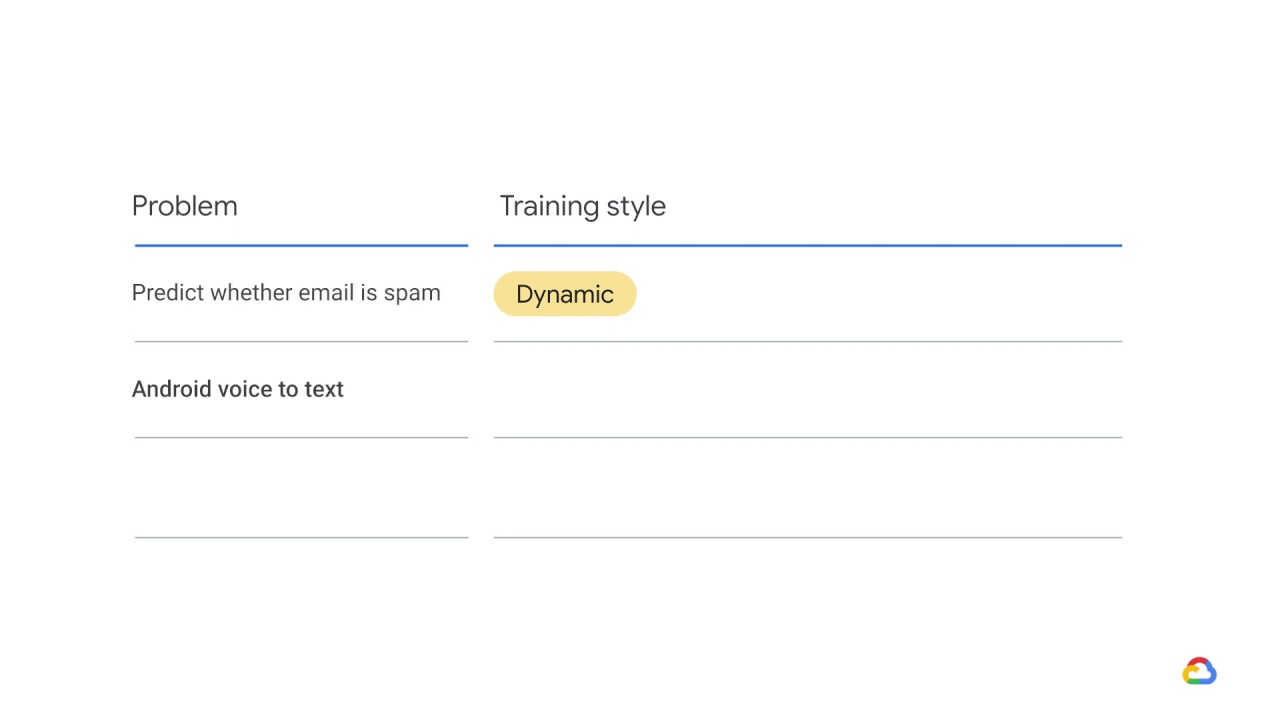
The second use case is Android voice-to-text.
This is again subtle.
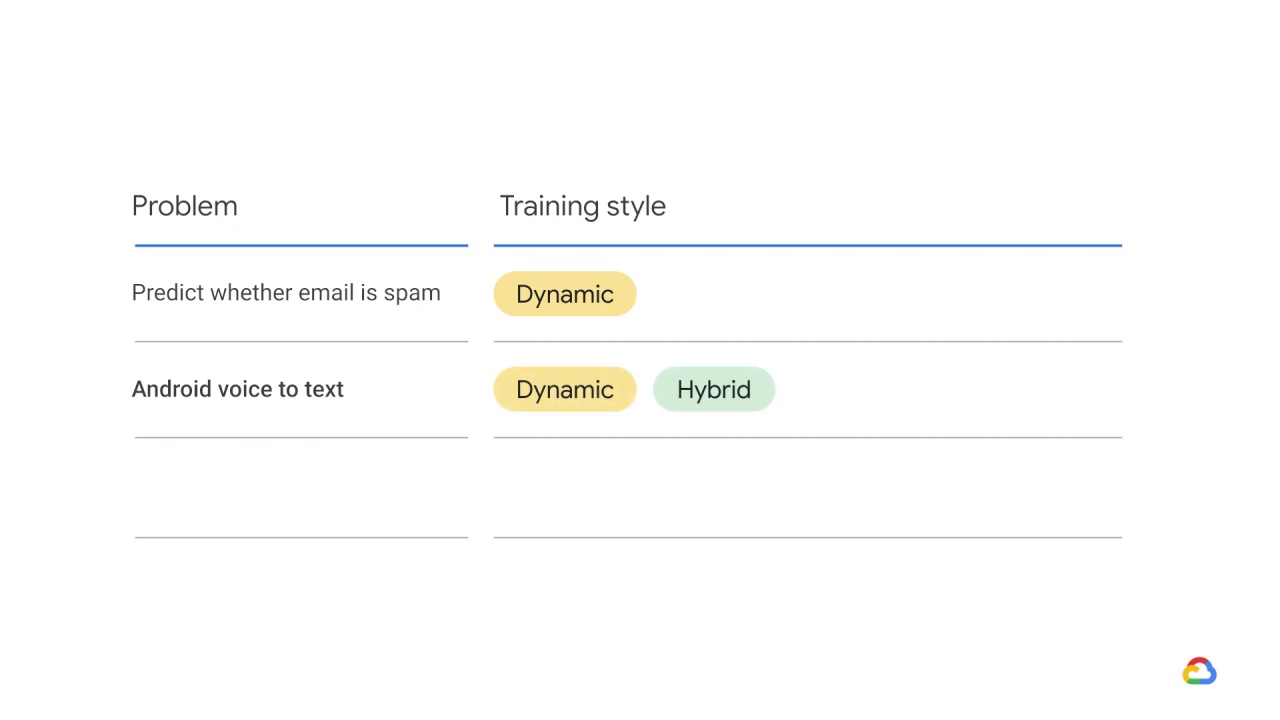
Inference is almost certainly online, since there’s such a long tail of possible voice clips.
But maybe with sufficient signal processing, some key phrases like “okay google” may have precomputed answers.
So, this would be dynamic or hybrid.
And the third use case is shopping ad conversion rate.
The set of all ads doesn’t change much from day to day.
Assuming users are comfortable waiting for a short while after uploading their ads, this could be done statically, and then a batch script could be run at regular intervals throughout the day.
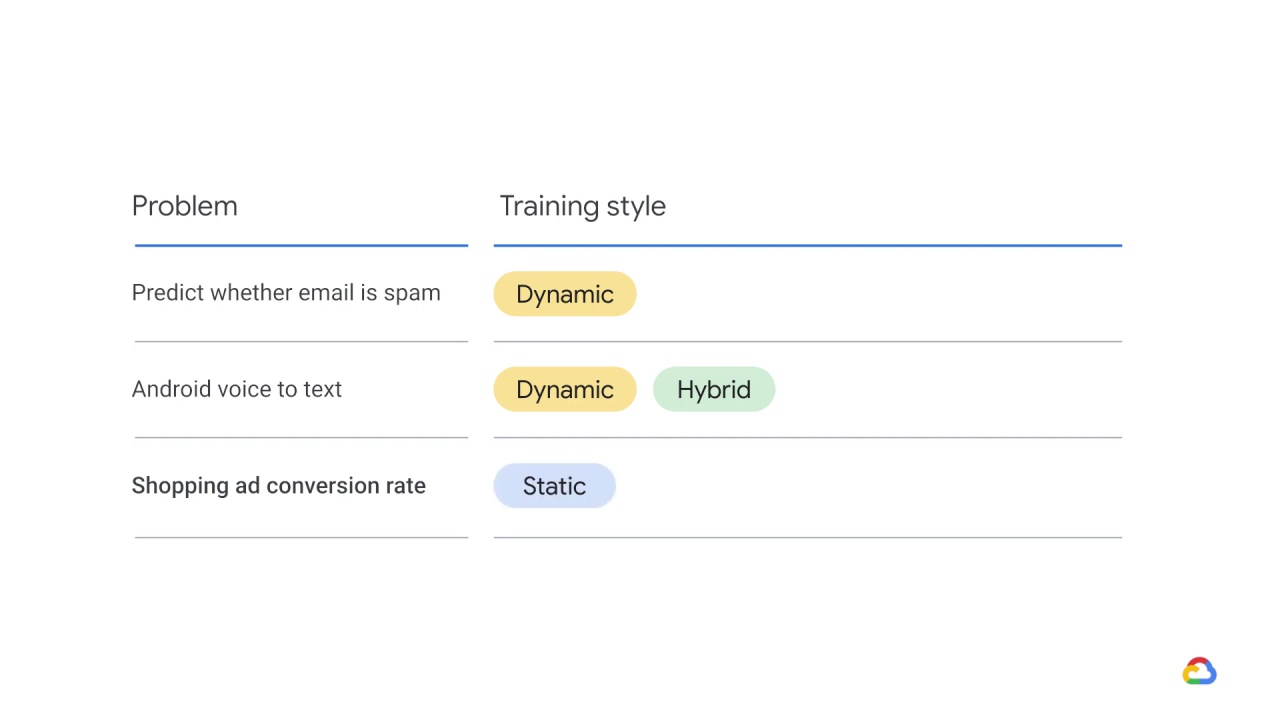
This would be static.
In practice, you’ll often use a hybrid approach.
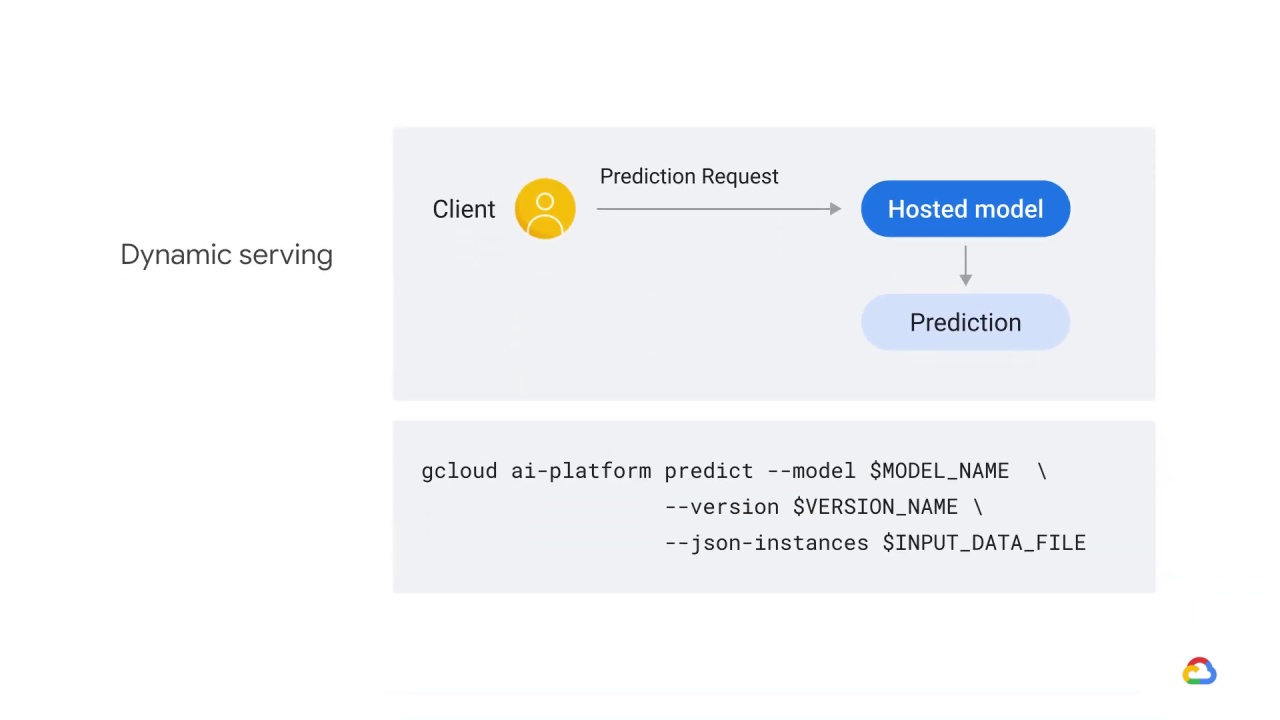
You might not have realized it, but dynamic serving is what we have learned so far.
Think back to the architecture of the systems we’ve used to make predictions: a model that lived in AI Platform was sent one or more instances and returned predictions for each.
If you wanted to build a static serving system, you would need to make three design changes.
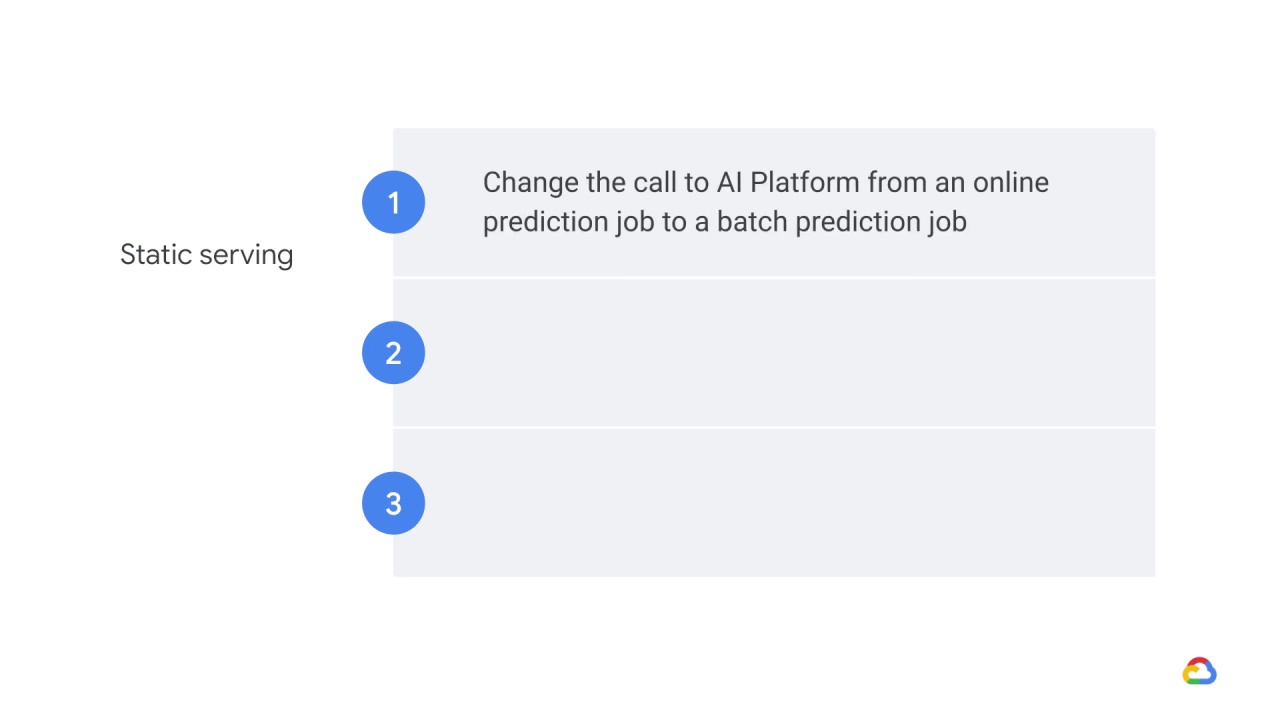
First, you would need to change your call to AI Platform from an online prediction job to a batch prediction job.
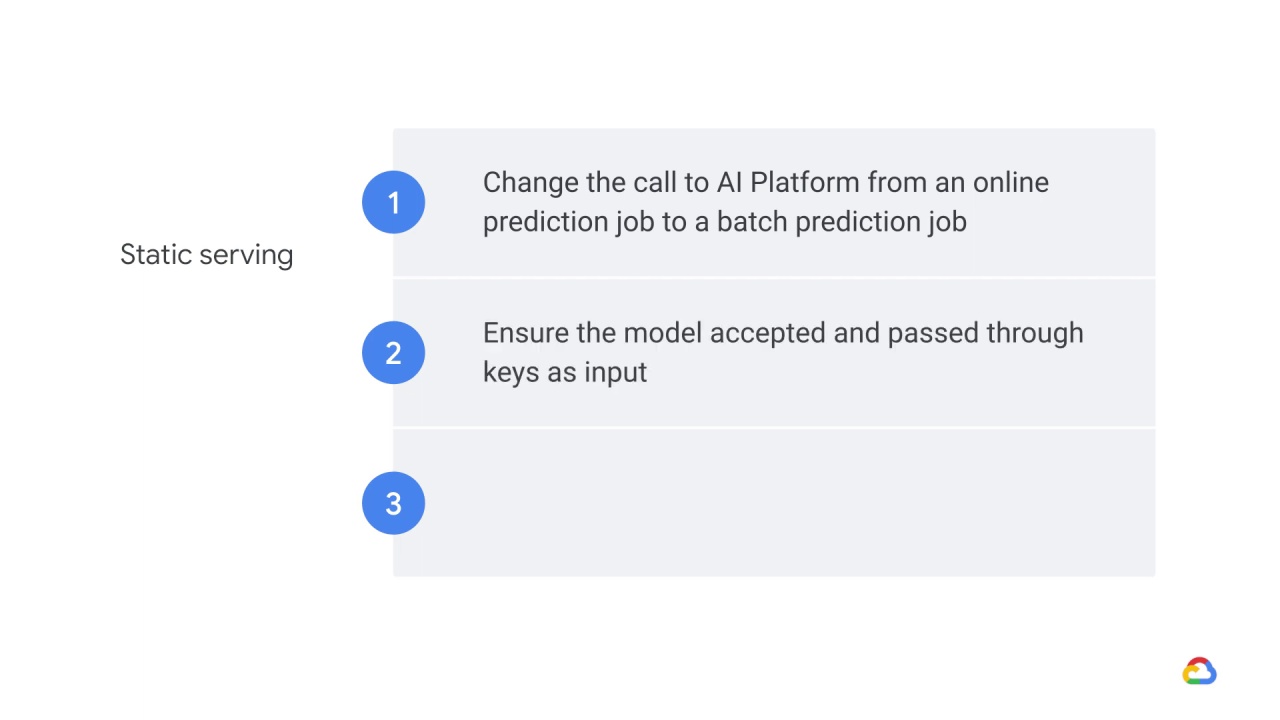
Second, you’d need to make sure that your model accepted and passed through keys as input.
These keys are what will allow you to join your requests to predictions at serving time.
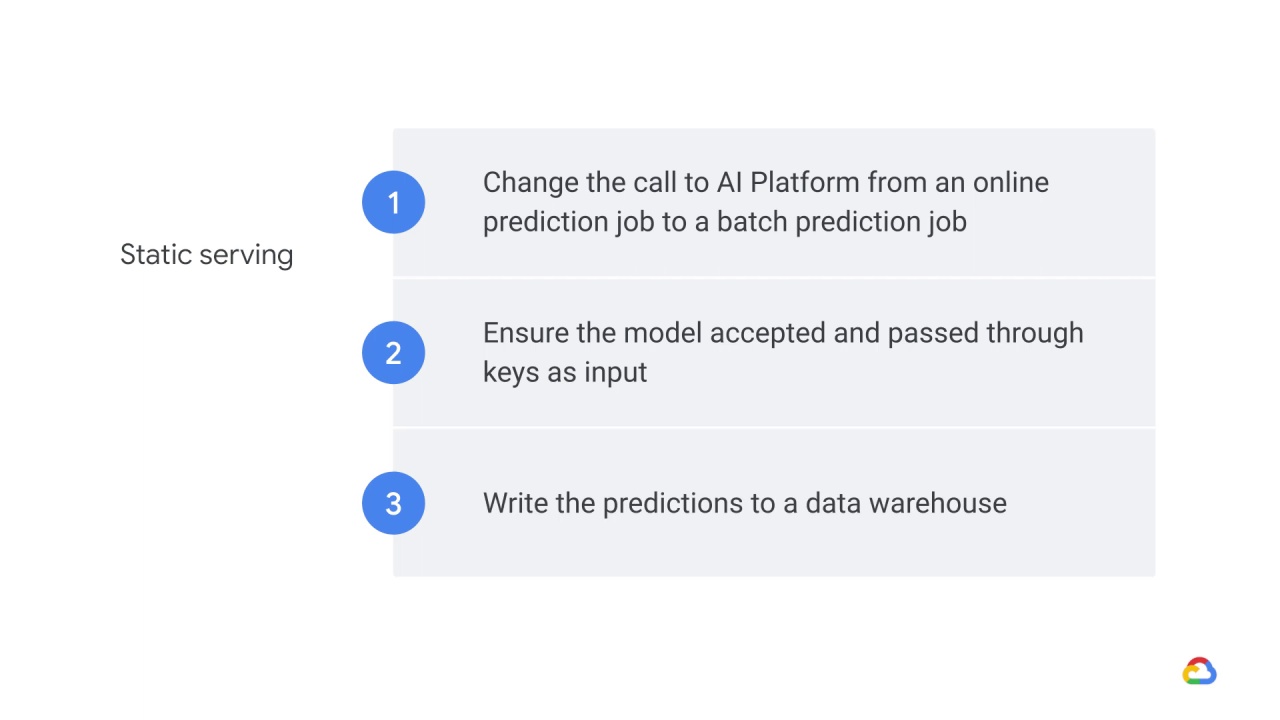
And third, you would write the predictions to a data warehouse, like BigQuery and create an API to read from it.

Although the details for each of these instructions are beyond the scope of this lesson, we’ve provided links in the course resources on:

Submitting a batch prediction job:
Enabling pass-through features in your model:
How to extend a canned TensorFlow Estimator (outdated)
And loading data into BigQuery: