Building a User Vector
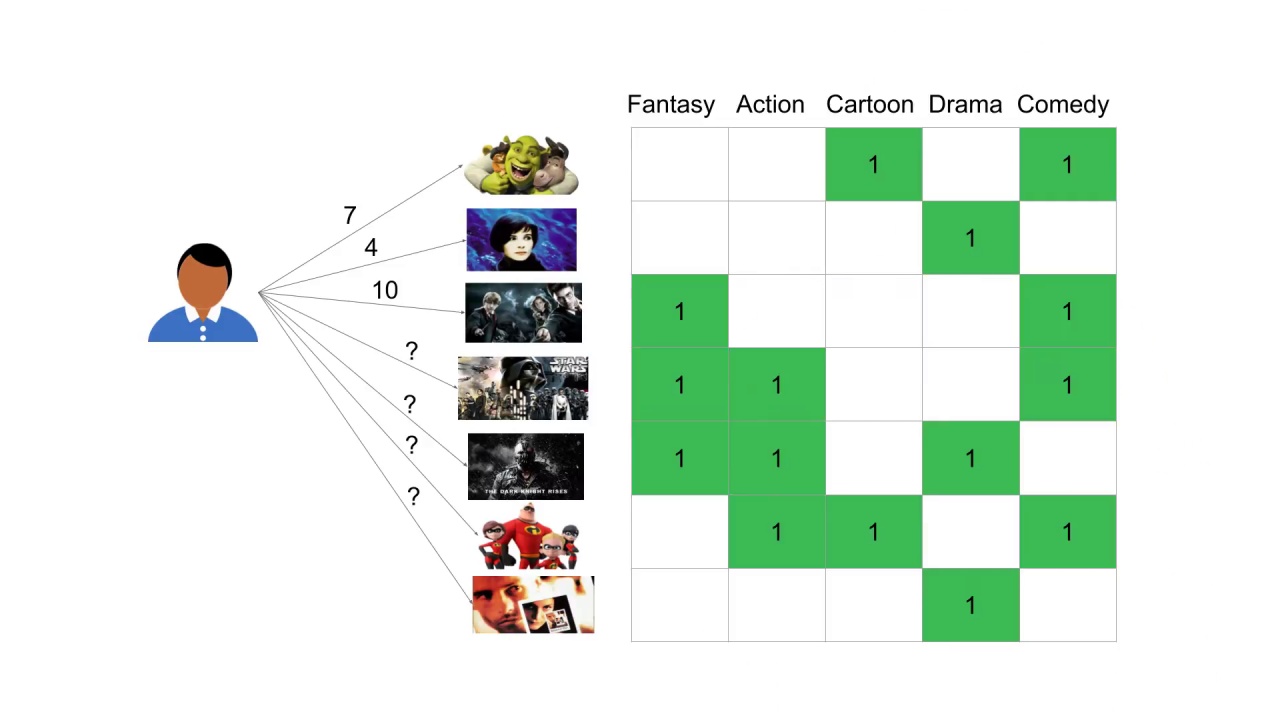
Consider a single user and suppose we have only seven movies in our database.
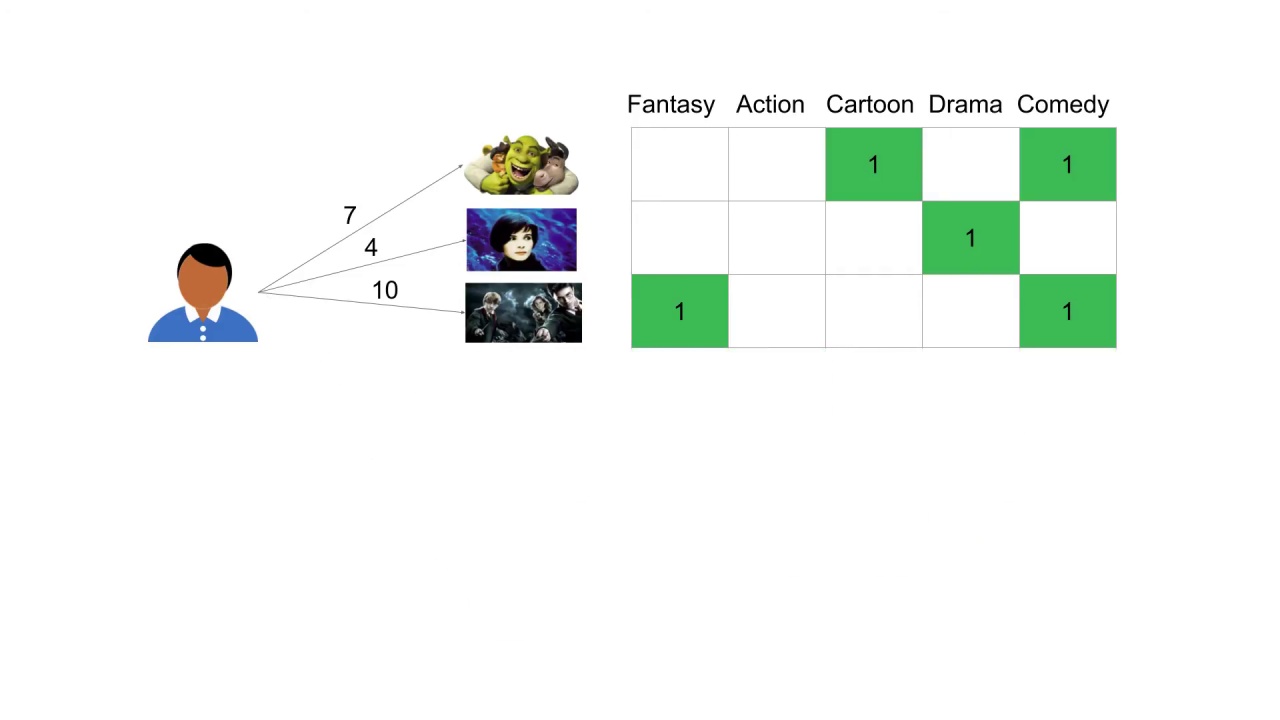
This user has seen and rated three of the movies.
We’d like too figure out which are the remaining four movies to recommend.
We’ll assume a rating scale of one to ten.
One means they didn’t like it and ten means they loved it.
This user gave Shrek a 7 out of 10, Blue a 4 out of 10 and Harry Potter a 10 out of 10.
We’d like to use this information to recommend one of the movies the user hasn’t seen yet.
To do this we represent each of these movies using predetermined features or genres.
Here we’re using the genres fantasy, action, cartoon, drama and comedy.
Each movie is k-hot encoded as to whether it has that feature.
Some movies satisfy only one feature, some have more.
You can imagine with more granularity of features we’d be able to describe our movies in a more precise way, but for now, we’ll just use these five categories.
Given their previous movie ratings we can describe our user in terms of the same features we use to describe our movies.
That is, we can place our user in the same 5-dimensional embedded feature space that we are using to represent our movies.
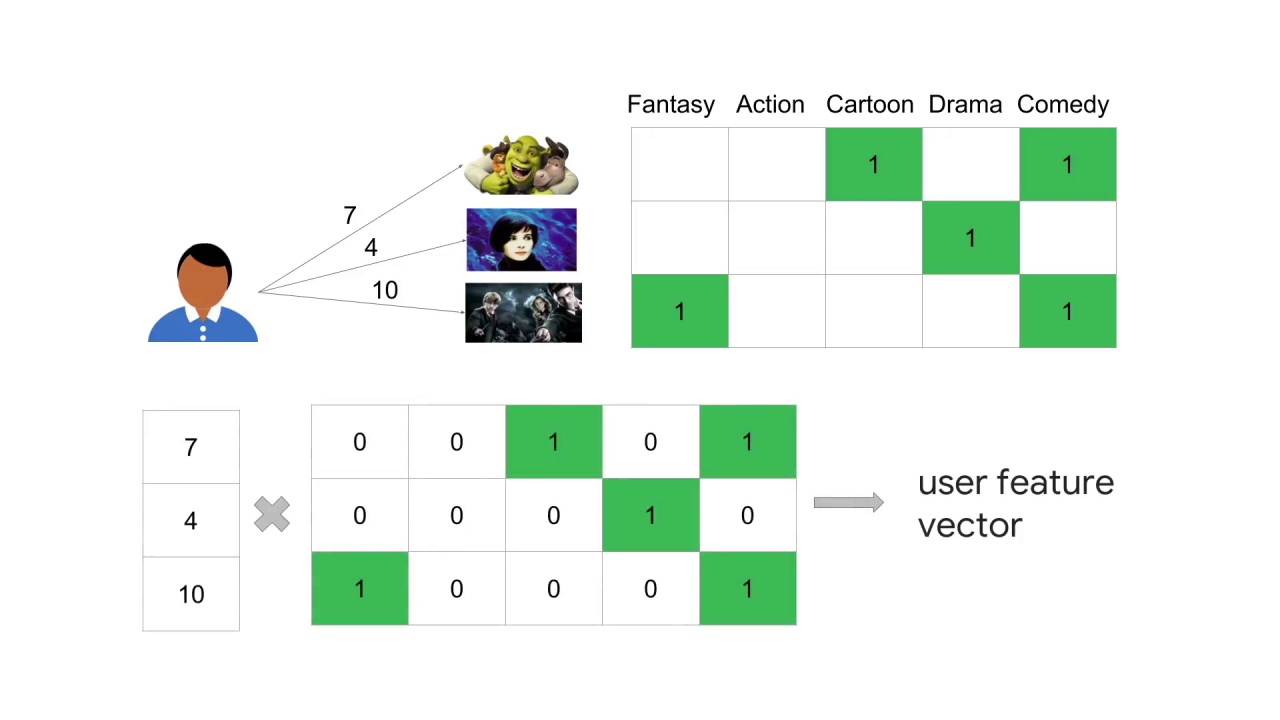
To do this we first scale each feature by this user’s ratings and then normalize the resulting vector.
This is called the user feature vector.
Basically it gives an idea of where our user sits in our embedding space of features based on their previous ratings of various movies in our database.
Let’s work through that now.
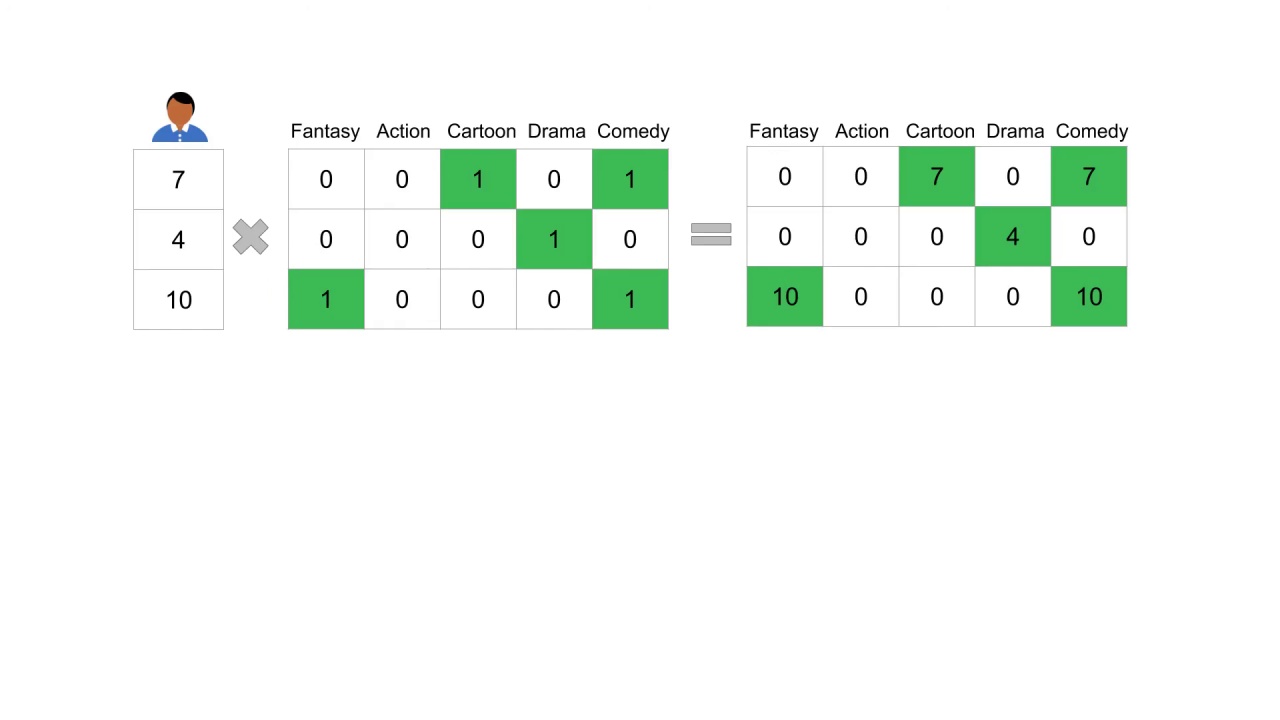
First, multiply the movie feature matrix by the ratings given by that user.
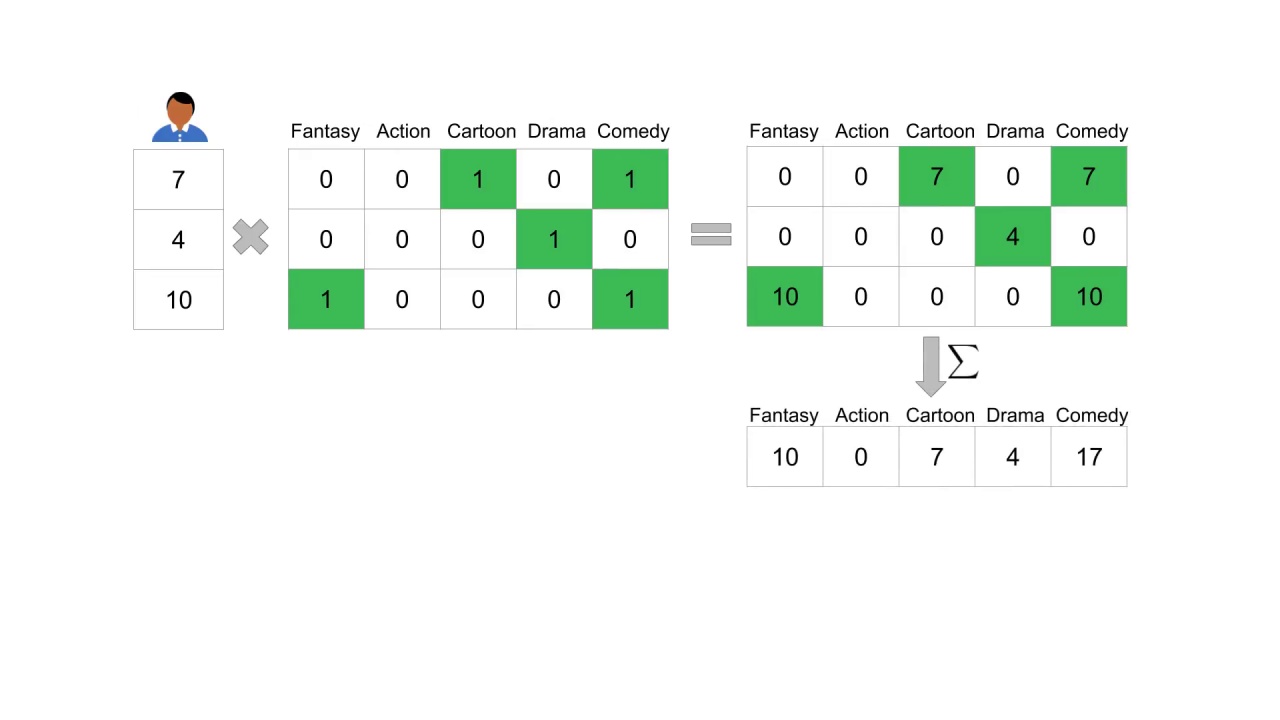
Then aggregate by somewhere across each feature dimension.
This gives us a five dimensional vector in our feature space embedding.
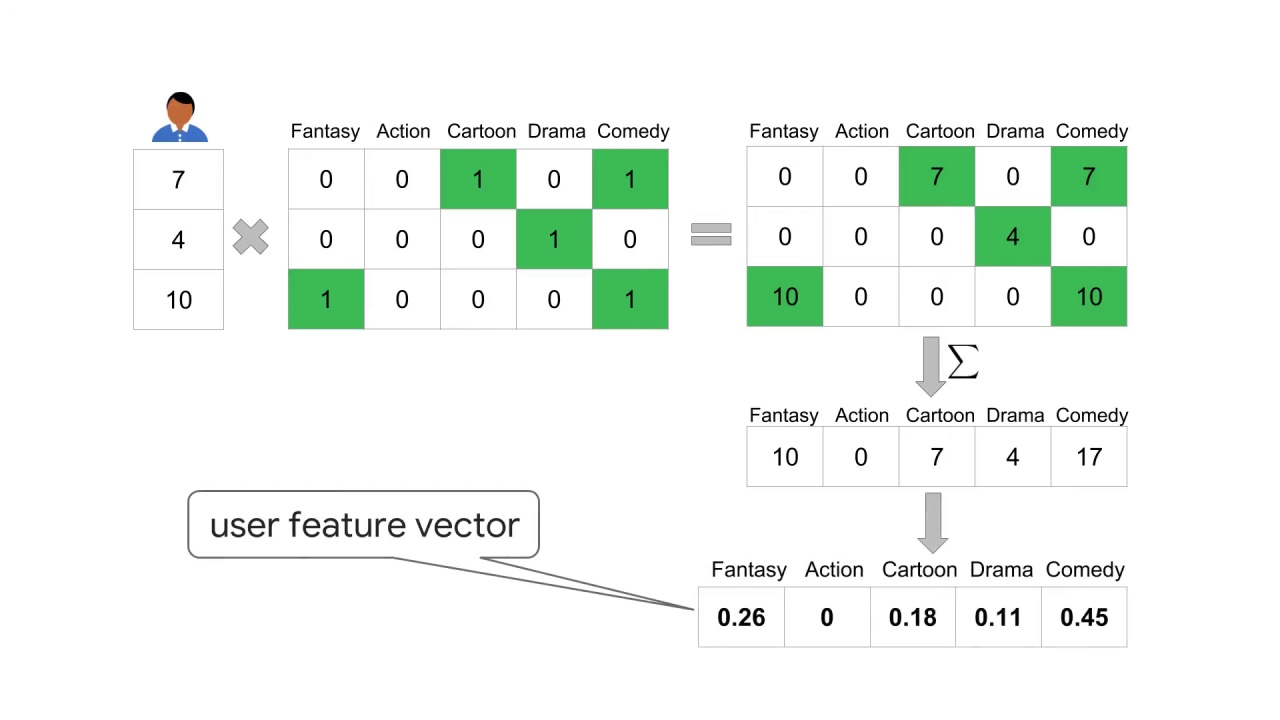
The user feature vector is the normalization of that vector.
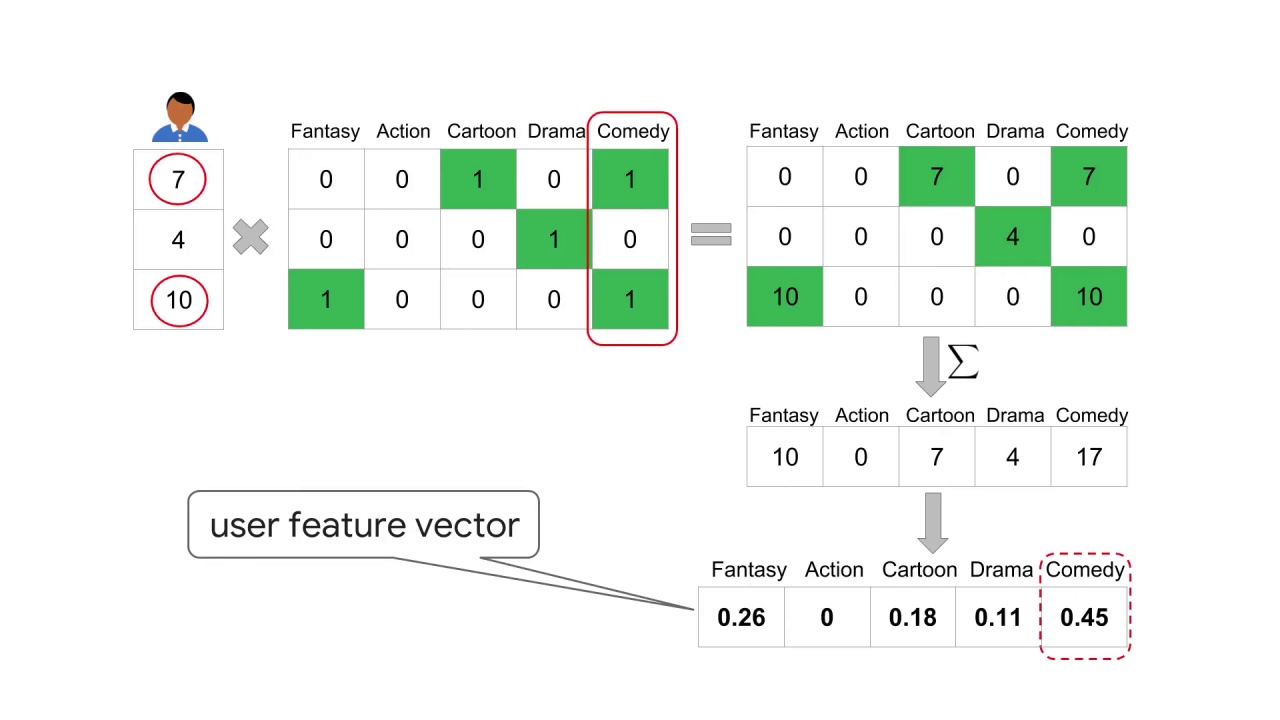
We see that for this user comedy seems to be a favorite category.
It has the largest value.
This makes sense looking back at their ratings for the three movies.
The two movies that were classified as comedy have relatively high ratings 7 out of 10 and 10 out of 10.

The drama category appears to be the lowest, which also makes sense looking at the rating of this user.
For the one drama movie they have seen they didn’t rate it very highly.
The numeric values of the user feature vector make sense with the intuition we have from the user’s ratings and the feature descriptions of the movies.
It is interesting to point out that the action dimension is zero for this user.
Is this because the user doesn’t like action at all?
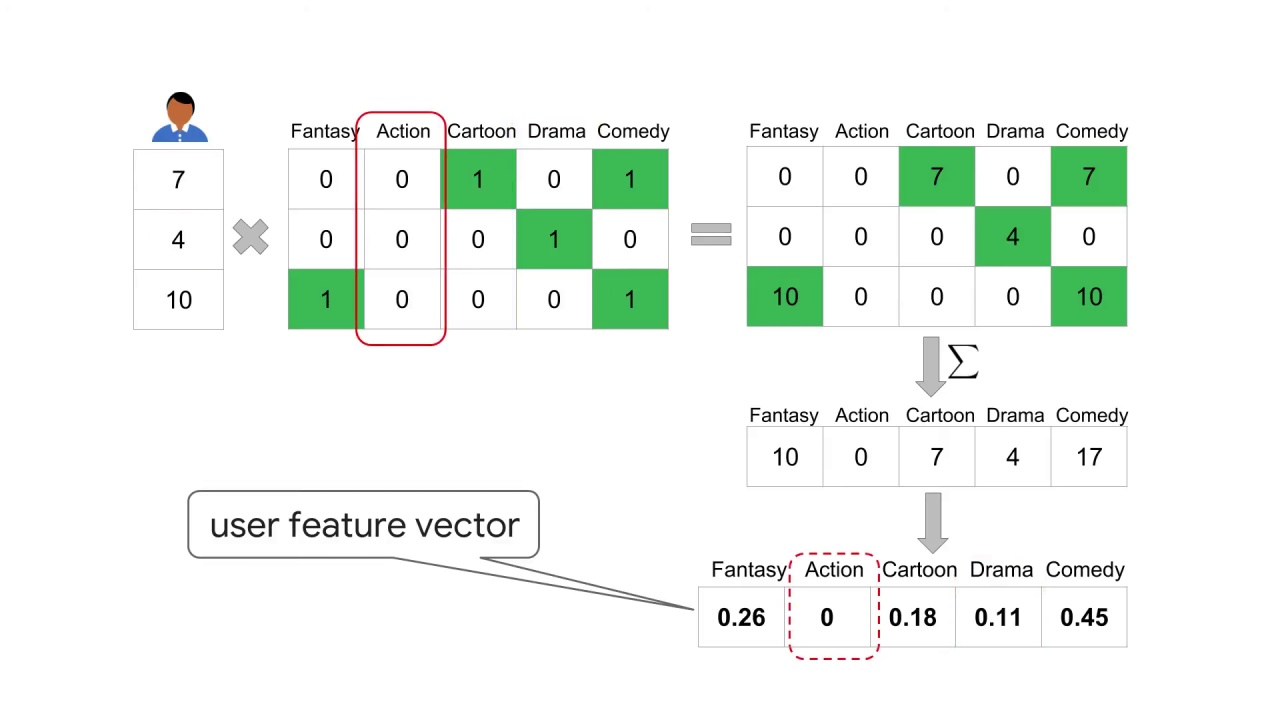
Not necessarily.
If you look at their ratings, none of the movies they’ve previously rated contain the action feature.
Think about how this affects our user feature vector.
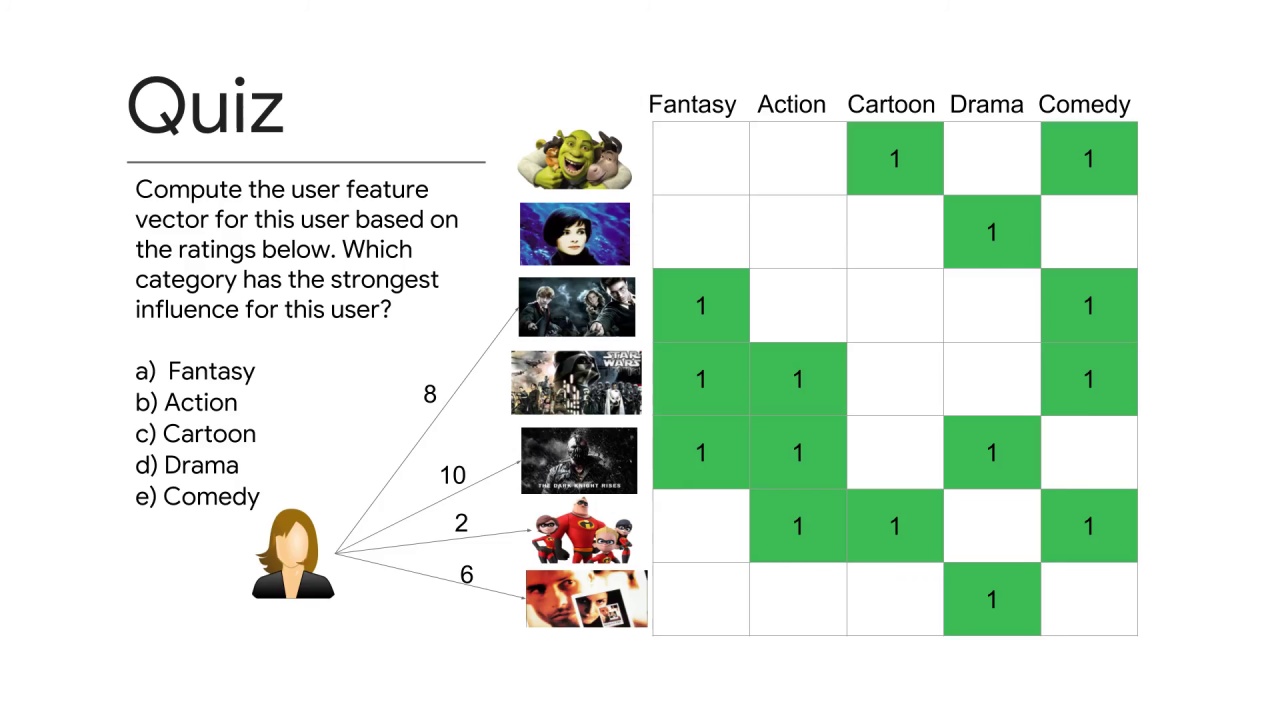
Let’s look at another user’s movie ratings.
Compute the user feature vector for this user based on their ratings for the movies and their respective features.
Which category has the strongest influence for this user?
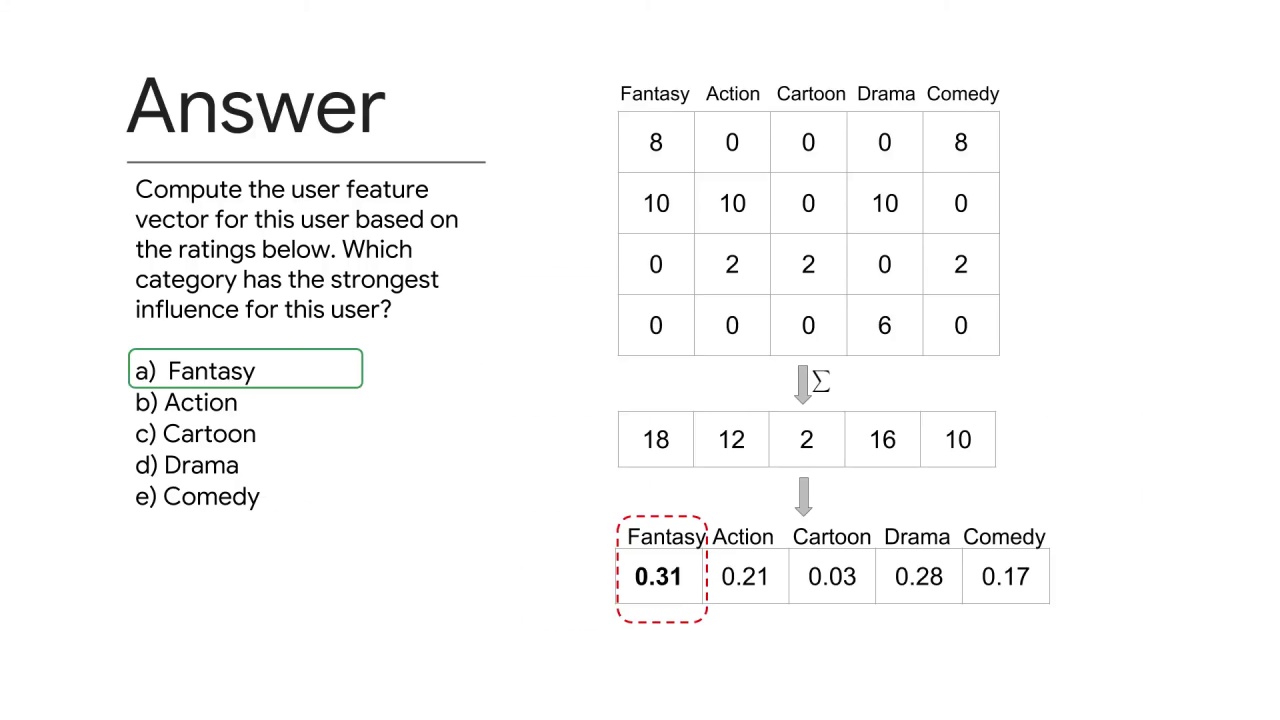
For this user the fantasy category has greatest value and thus the strongest influence.
To verify this first scale the movie feature matrix by the user’s ratings, then sum across the feature columns.
The user feature vector is the normalization of that vector.
In doing this computation we see that fantasy has a relative score of 0.31 although drama is close with 0.28.
This means the fantasy category has the strongest influence.