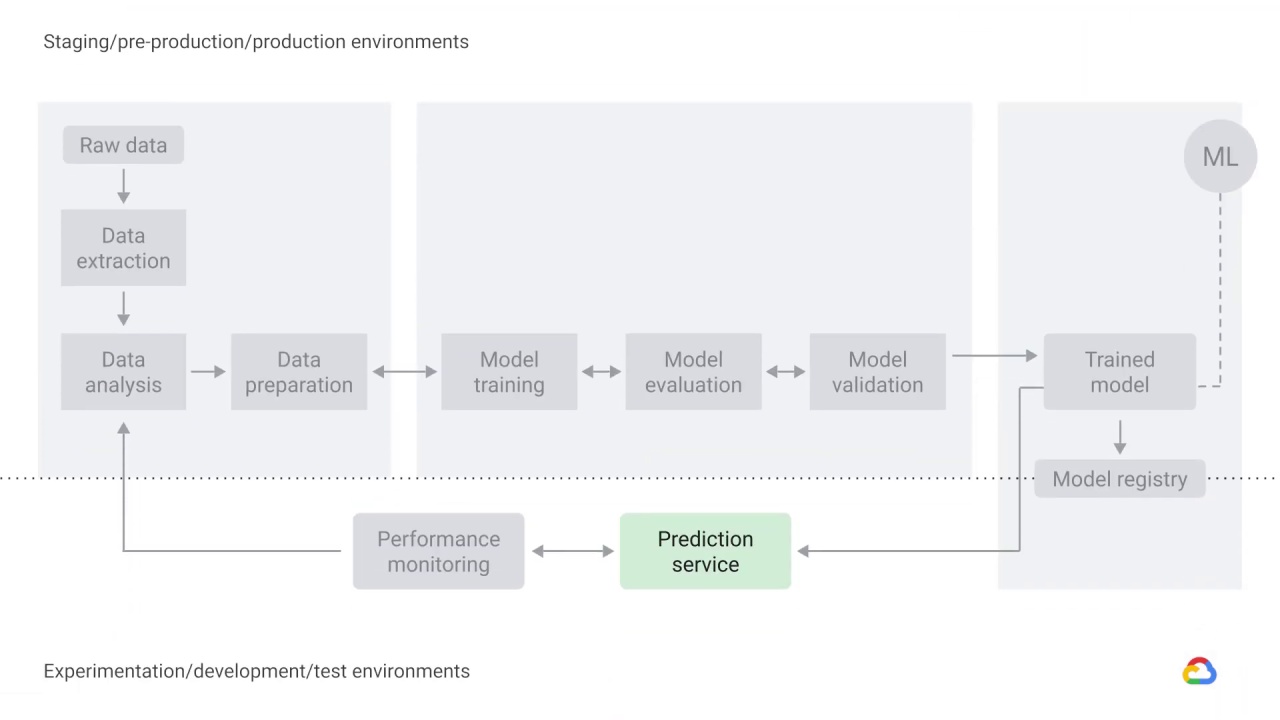
Trained model, prediction service, and performance monitoring
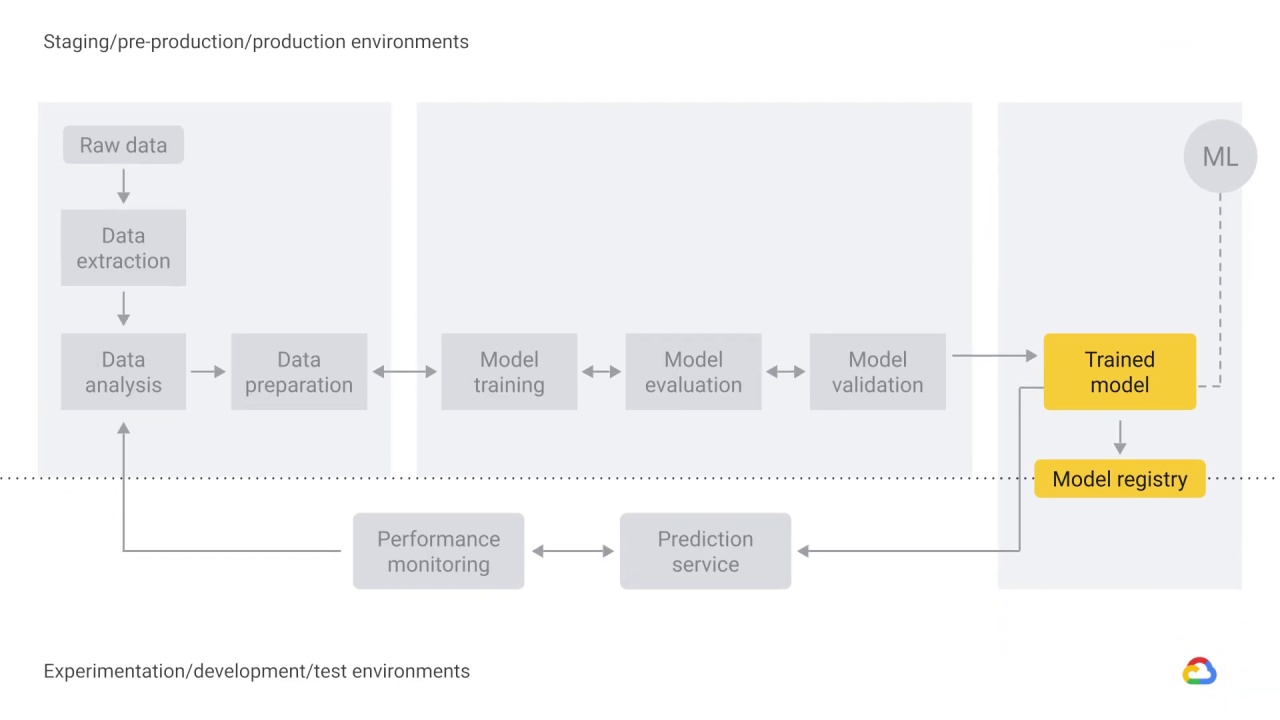
The output of model validation is a trained model that can be pushed to the model registry.
A machine learning model registry is a centralized tracking system that stores lineage, versioning, and related metadata for published machine learning models.
A registry may capture governance data required for auditing purposes, such as:
Who trained and published a model
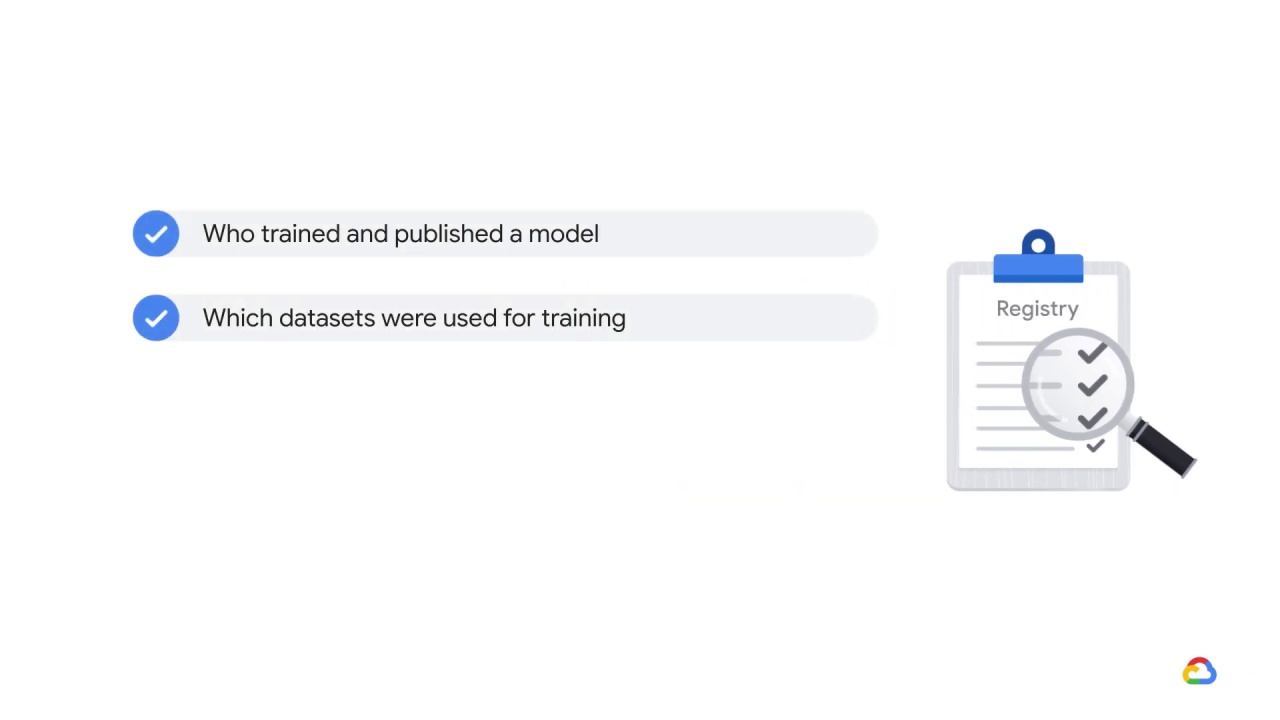
Which datasets were used for training
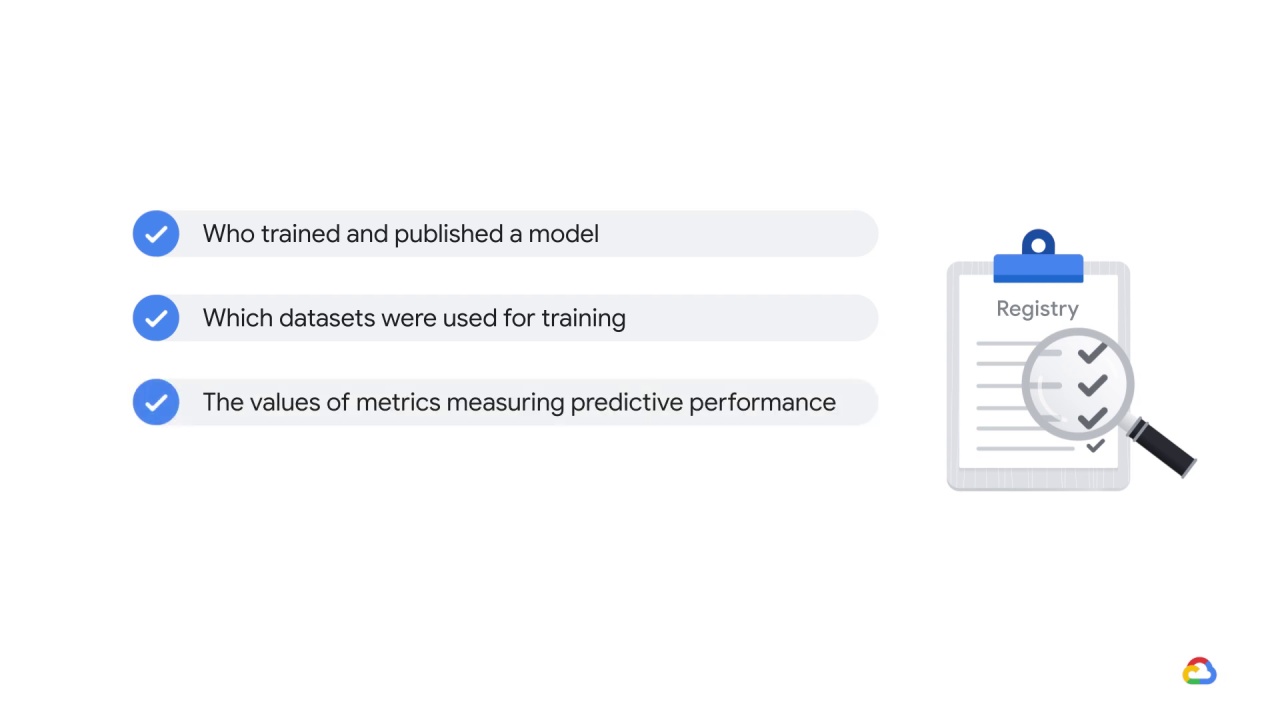
The values of metrics measuring predictive performance
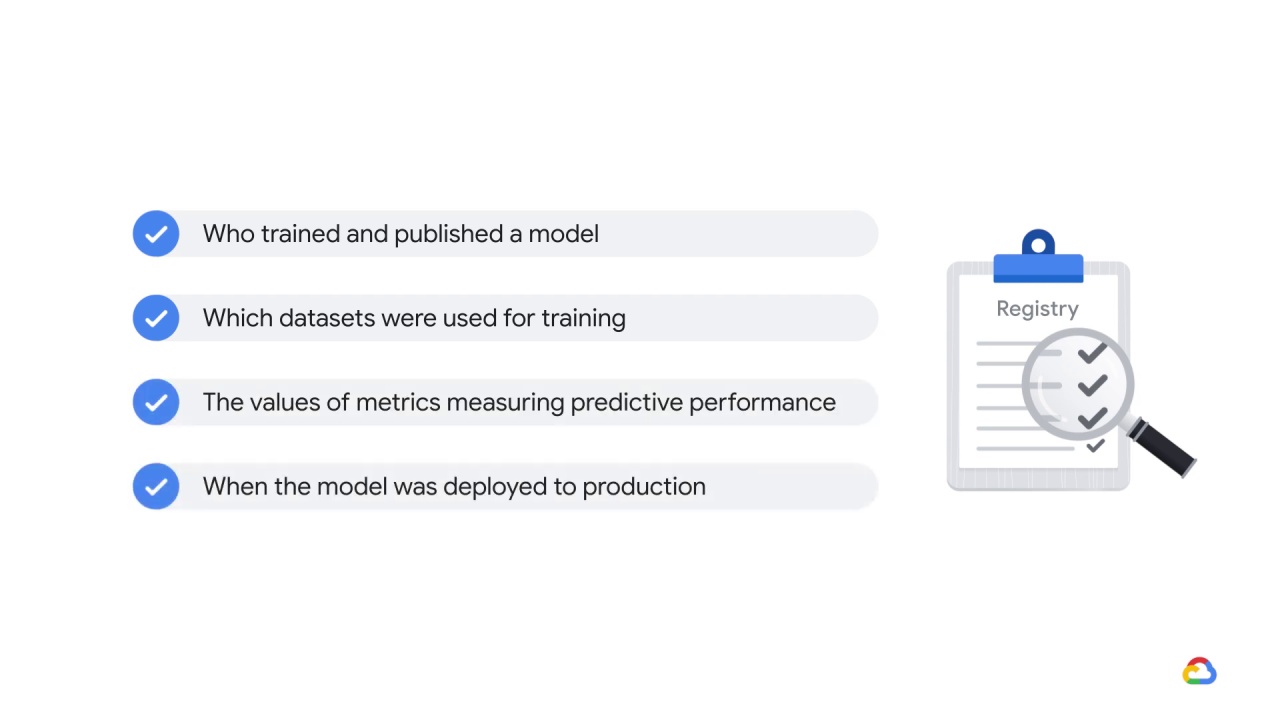
When the model was deployed to production
It’s a place to find, publish, and use ML models or model pipeline components.
Machine learning uses data to answer questions.
So prediction, or inference, is the step where we get to answer the questions we posed–whether it be a business problem or an academic research problem.
The trained model is served as a prediction service to production.
It’s important to note that the process is concerned only with deploying the trained model as a prediction service, for example, a microservice with a REST API, rather than deploying the entire ML system.
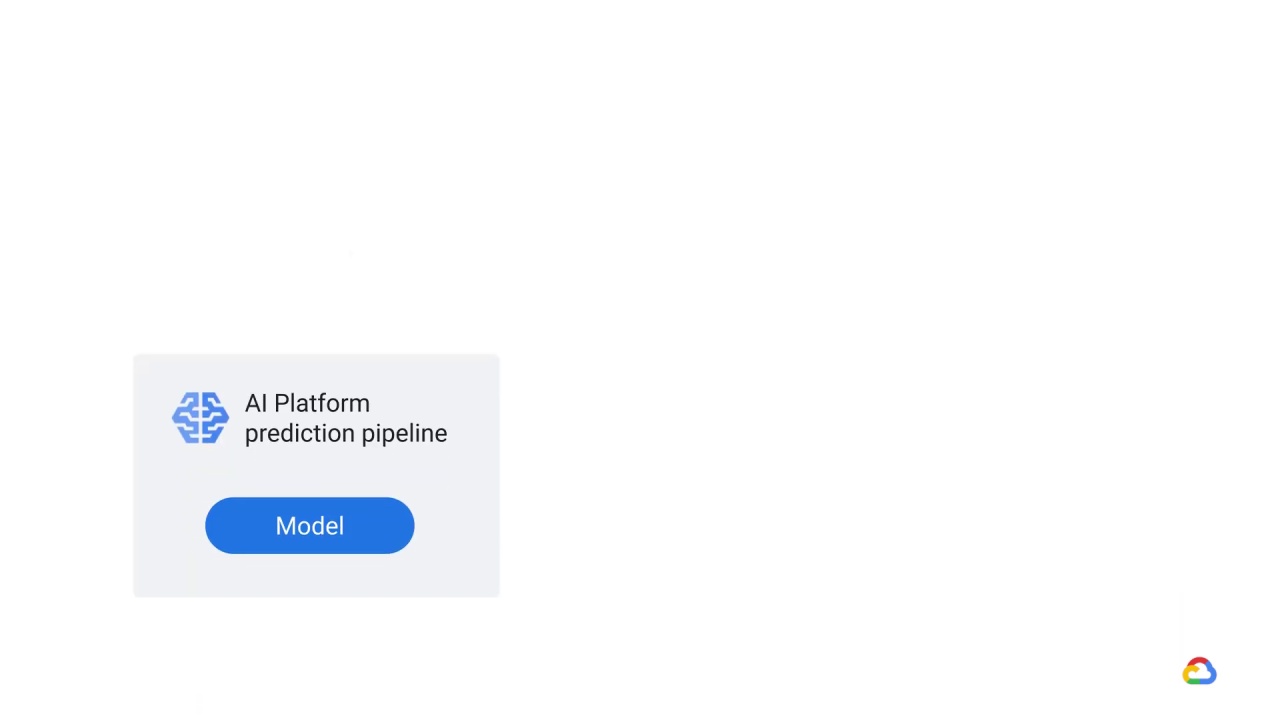
For example, Google’s AI Platform Prediction service has an API for serving predictions from machine learning models.
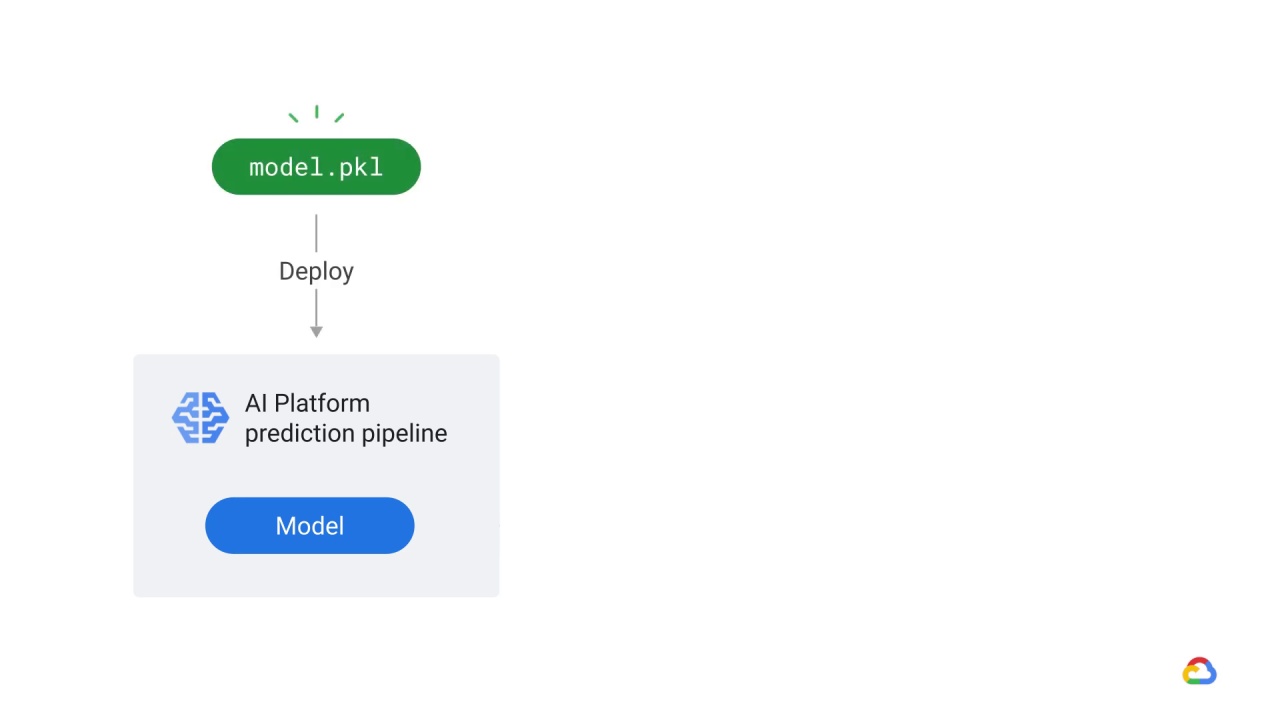
In this particular example, AI Platform Prediction retrieves the trained model and saves it as a pickle in Cloud Storage.
Pickle is the standard way of serializing objects in Python.
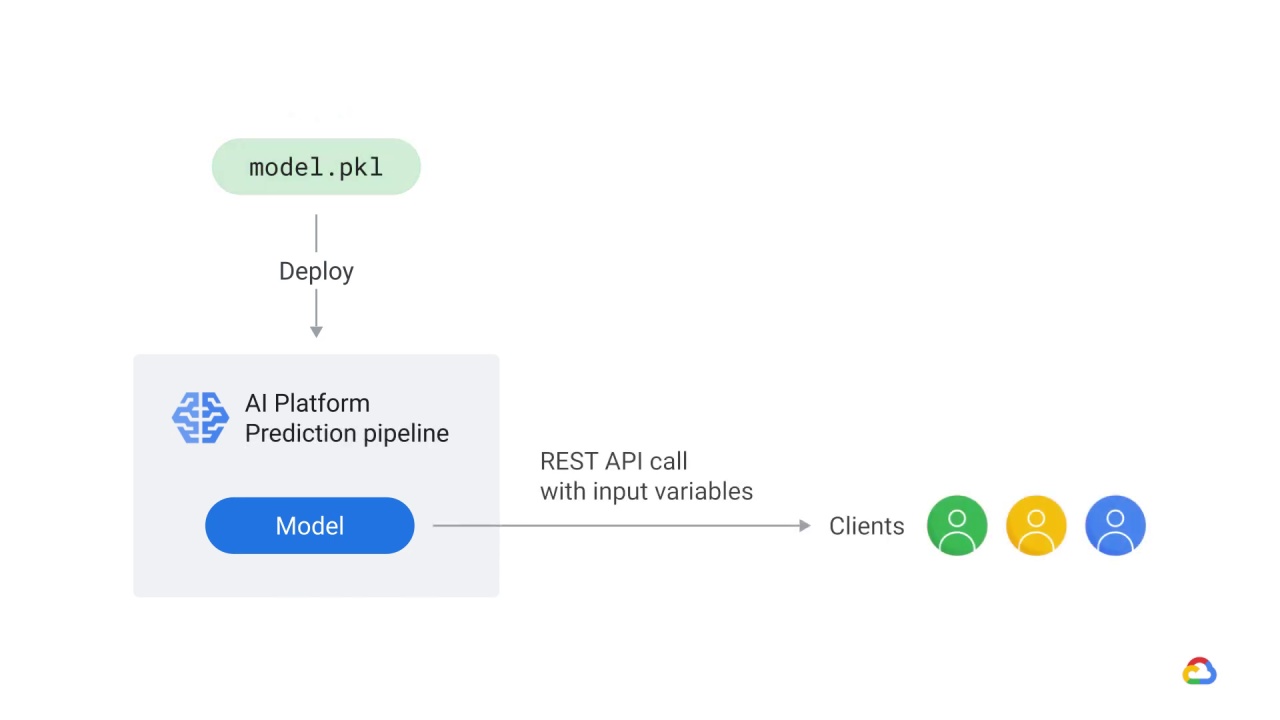
Trained models deployed in AI Platform Prediction service are exposed as REST endpoints that can be invoked from any standard client that supports HTTP, such as a JupyterLab notebook.
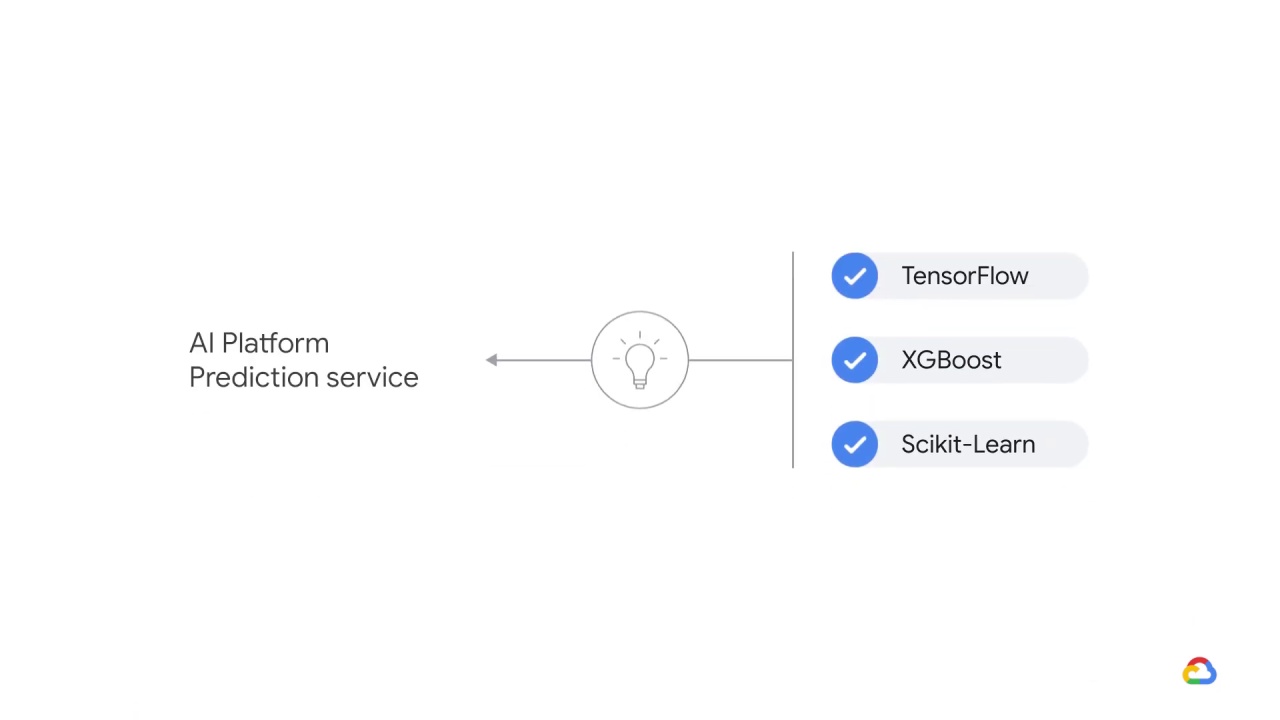
The AI Platform Prediction service can host models trained in popular machine learning frameworks including TensorFlow, XGBoost, and Scikit-Learn.
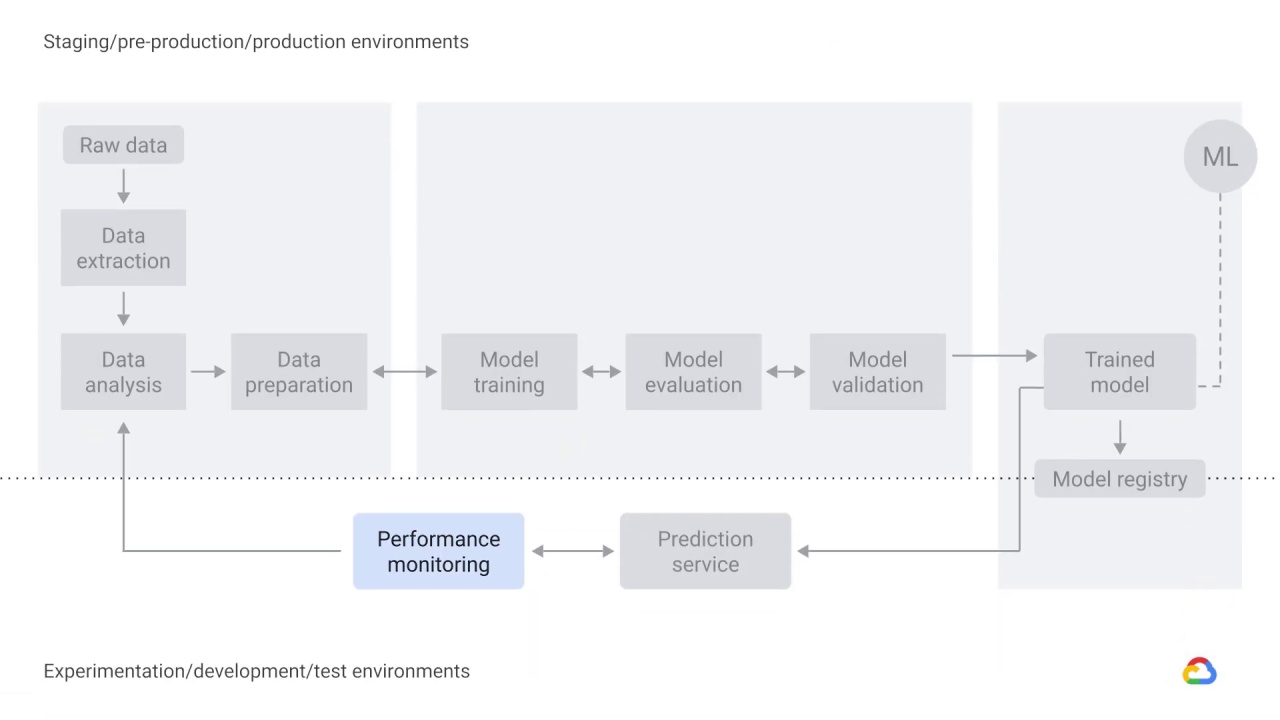
As a best practice, you need a way to actively monitor the quality of your model in production.
Monitoring lets you detect model performance degradation or model staleness.
The output of monitoring for these changes then feeds into the data analysis component, which could serve as a trigger to execute the pipeline or to execute a new experimental cycle.
For example, monitoring should be designed to detect data skews, which occur when your model training data is not representative of the live data.
That is to say, the data that we used to train the model in the research or production environment does not represent the data that we actually get in our live system, and this leads to model staleness.
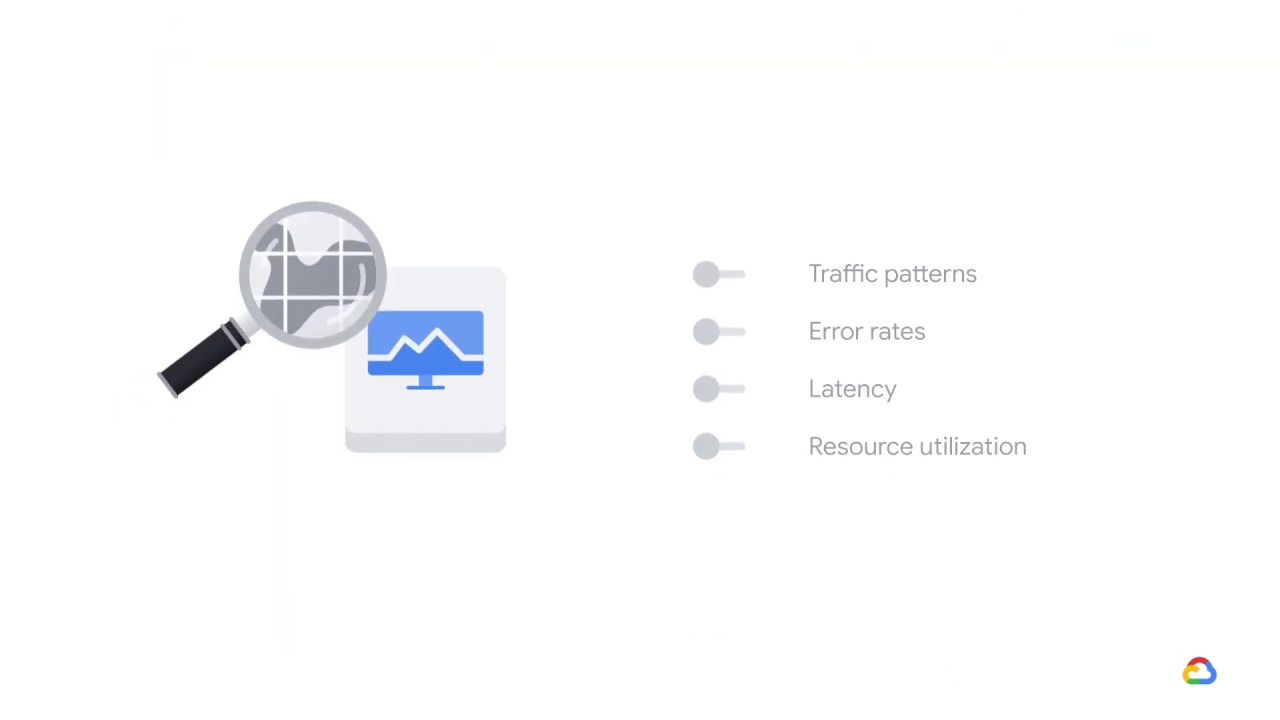
To understand other performance metrics, you can configure Google’s Cloud Monitoring to monitor your model’s:

Traffic patterns
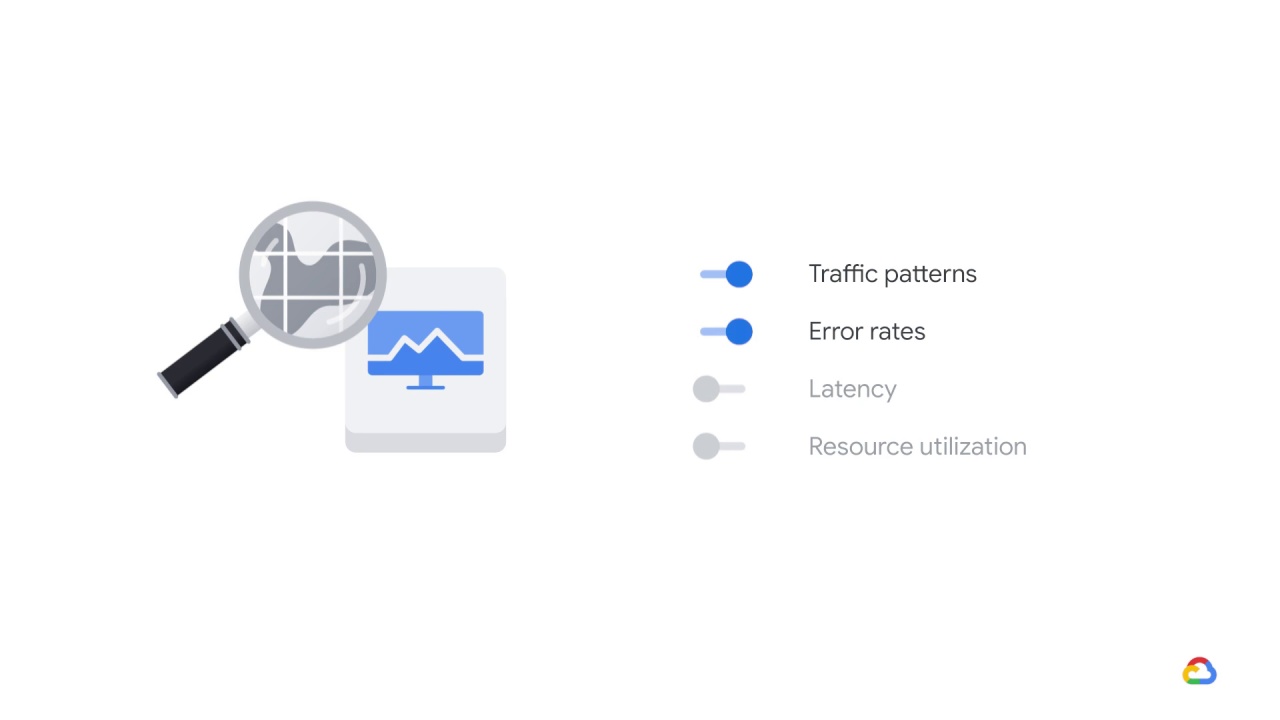
Error rates
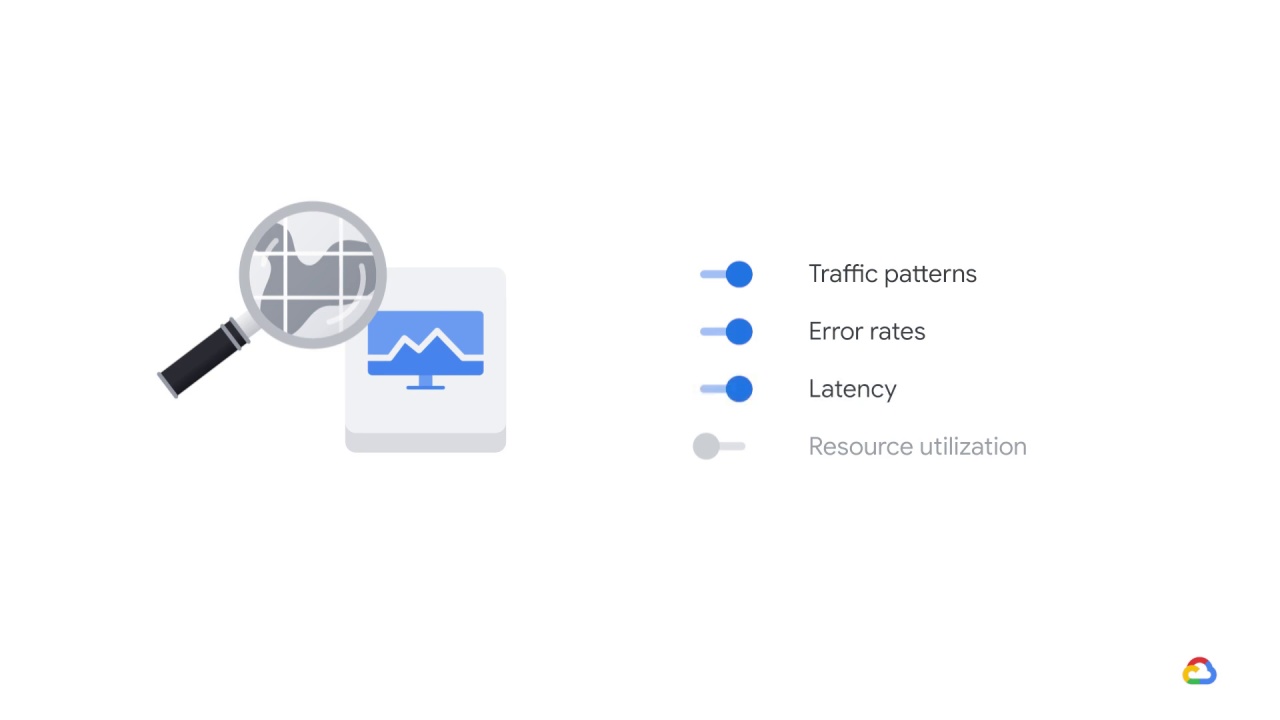
Latency
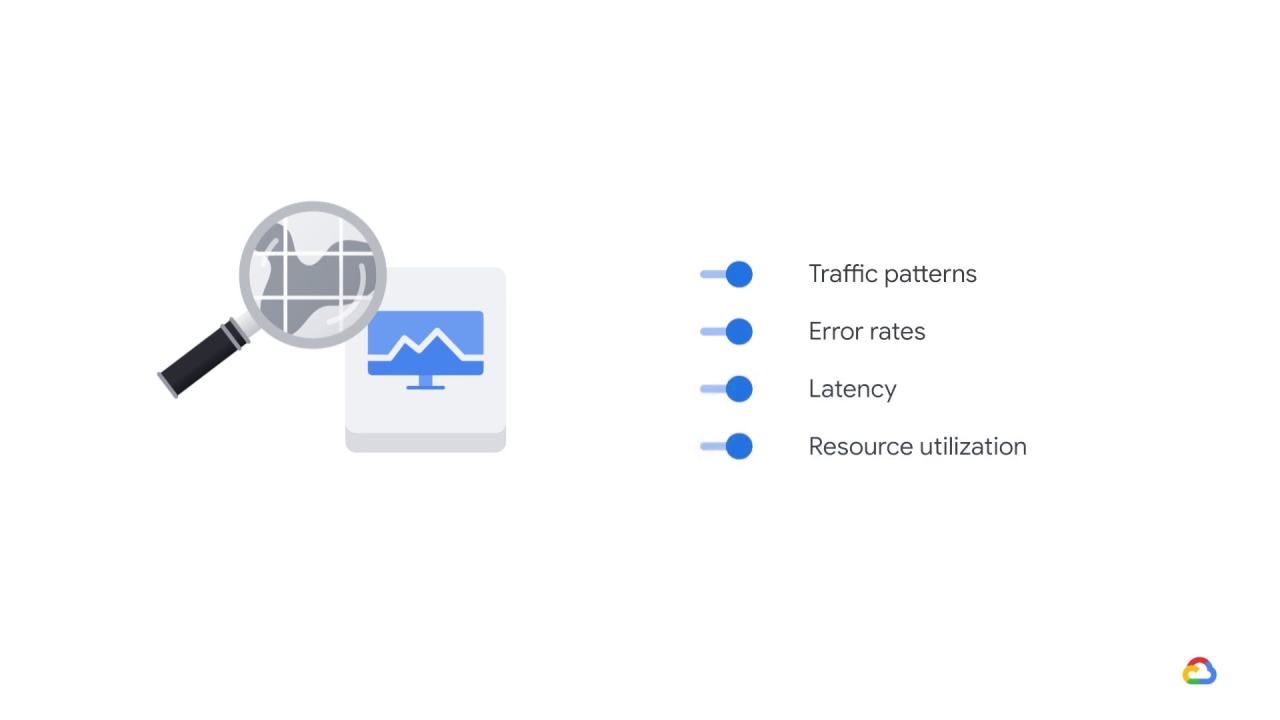
Resource utilization
This can help spot problems with your models and find the right machine type to optimize latency and cost.