Diagnosing a production model
In this section, we’ll put our learnings into practice by diagnosing a production model.
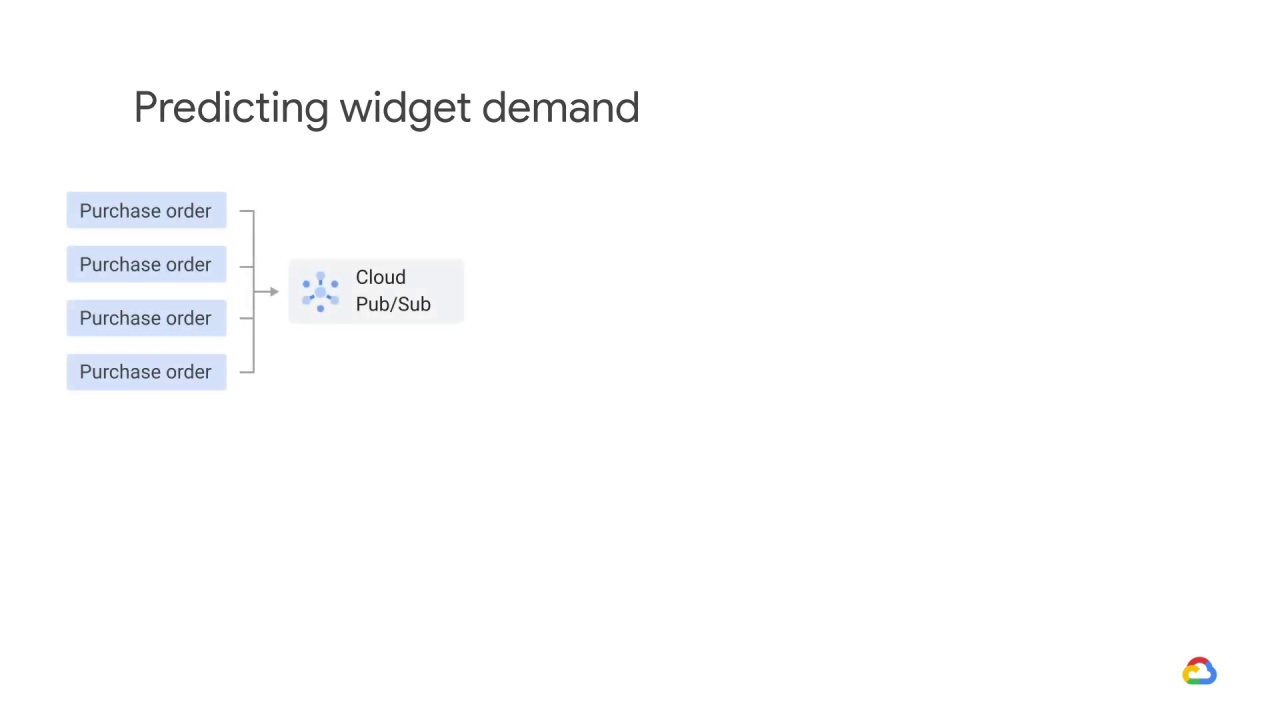
Let’s say you’ve architected an ML system to predict the demand for widgets.
Your streaming purchase orders arrive in Pub/Sub and are fulfilled asynchronously, but let’s ignore fulfillment and focus on demand prediction.
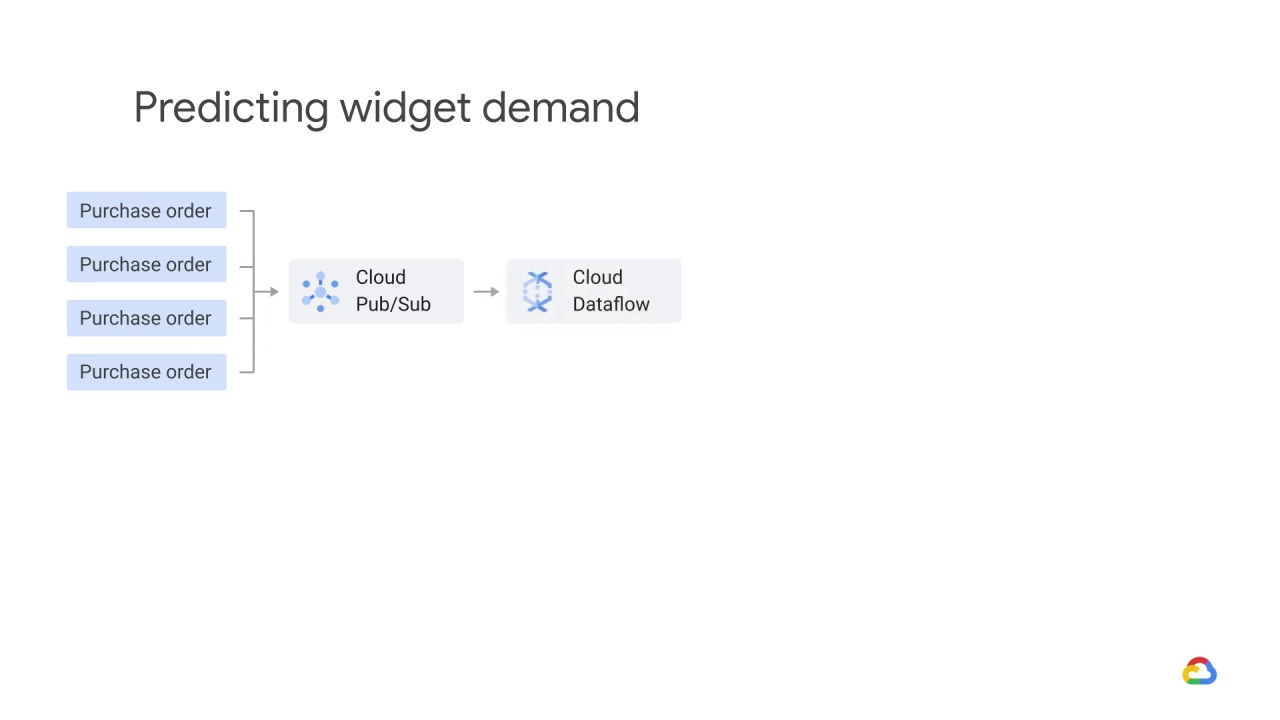
Dataflow processes this stream and using windowing functions, aggregates purchase orders over time.
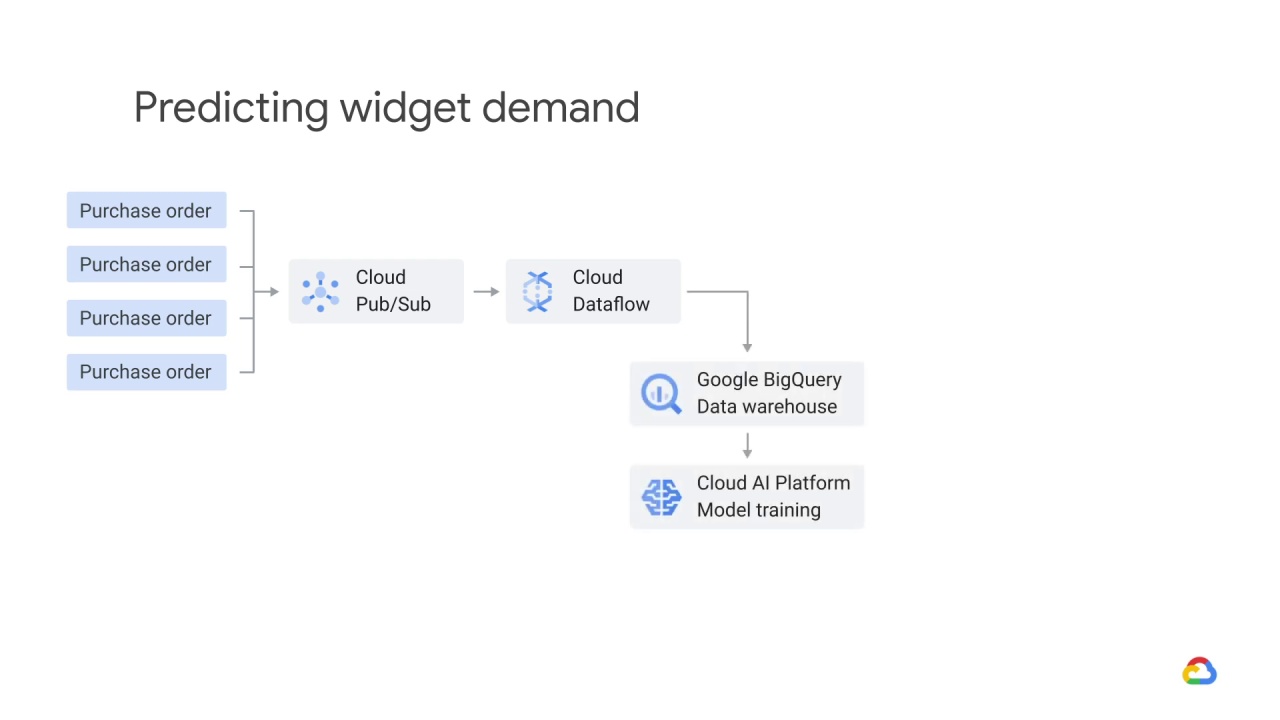
It then uses the output of these windowing functions and passes that to an ML model that lives in Cloud AI Platform, where the data are joined against historical purchase data that lives in a data warehouse like BigQuery.
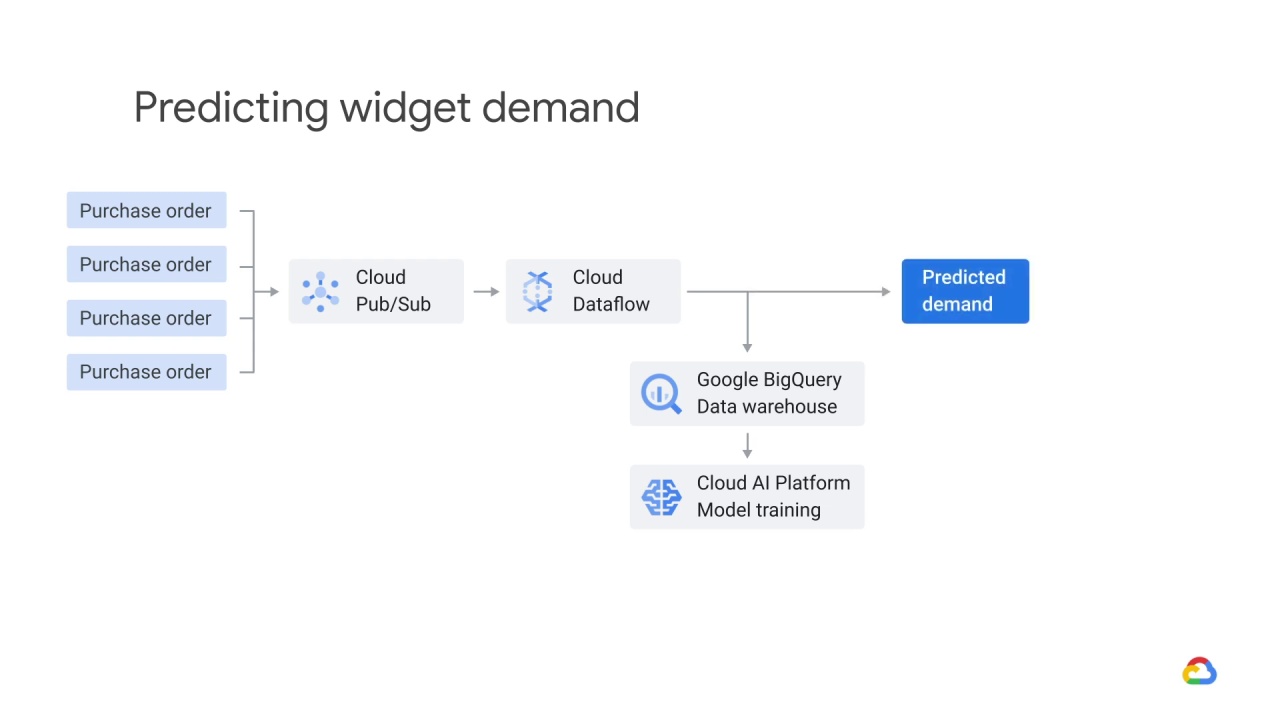
The model returns a predicted demand for a particular time.
The predictions returned by the model are both written to
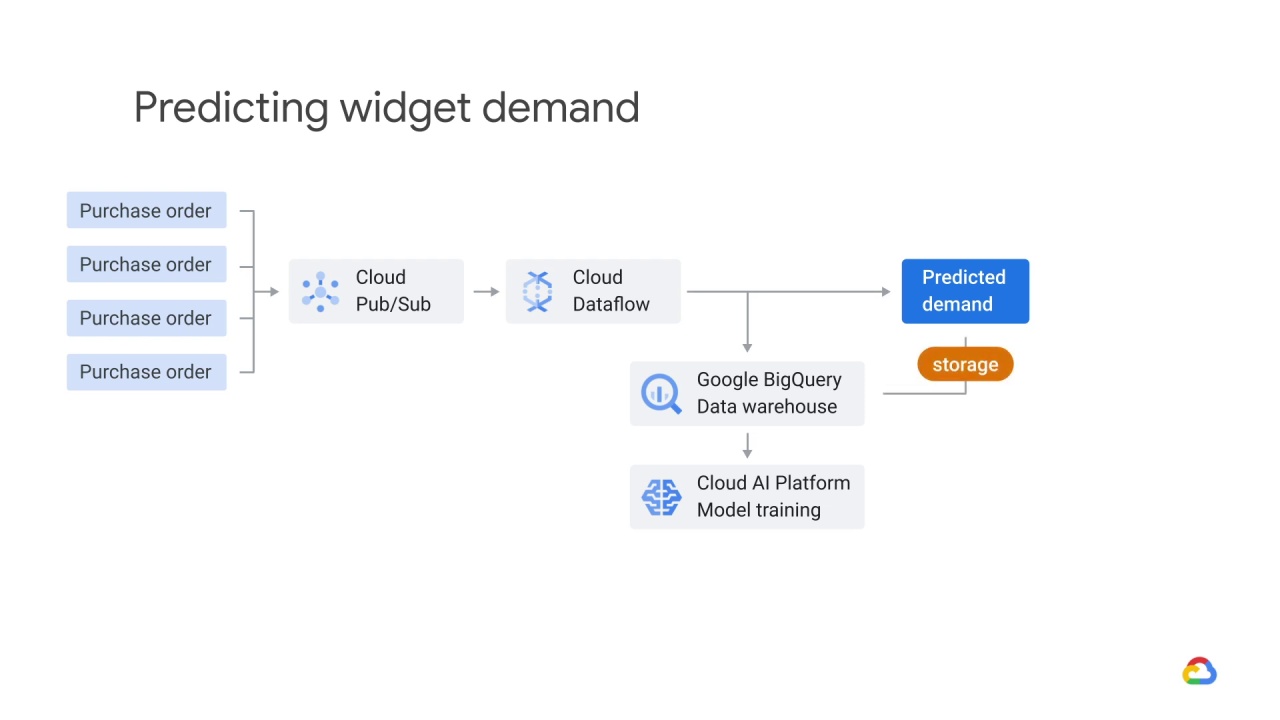
storage
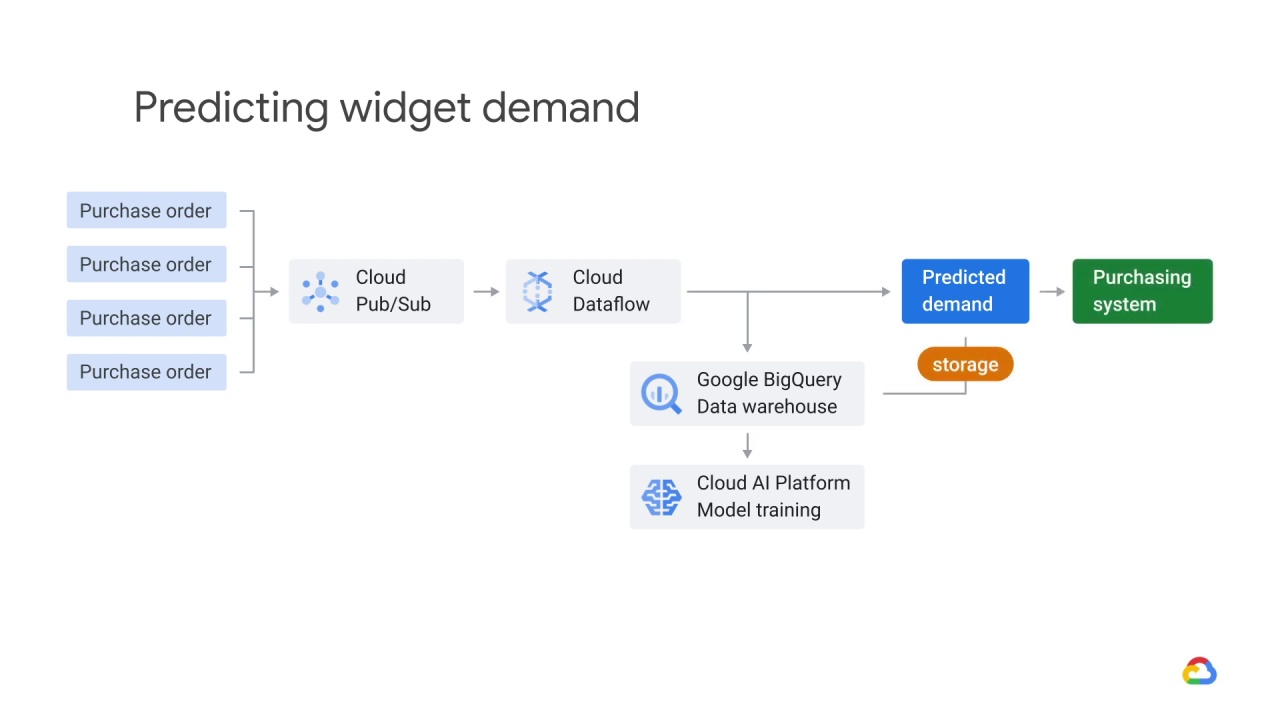
and sent to the purchasing system.
The purchasing system determines what’s in
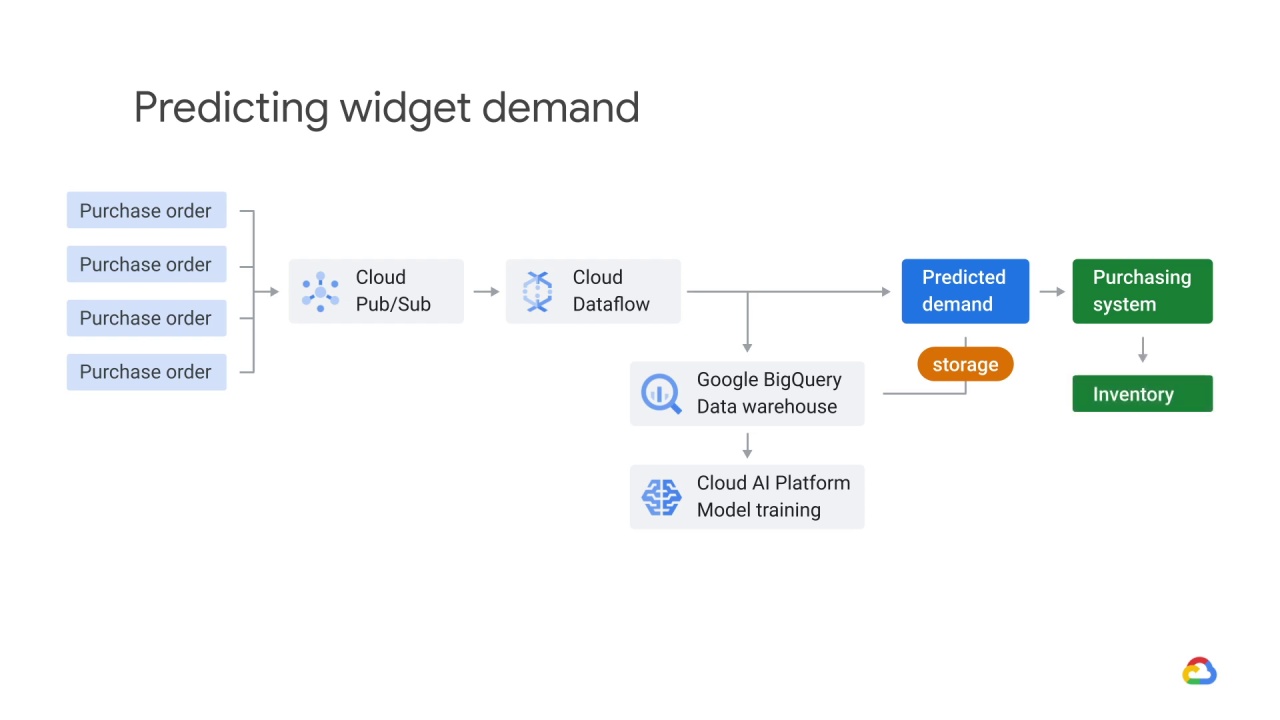
the inventory, and the inventory is also logged in the data warehouse.
The model is retrained daily, based on actual inventory, sales, and other signals.
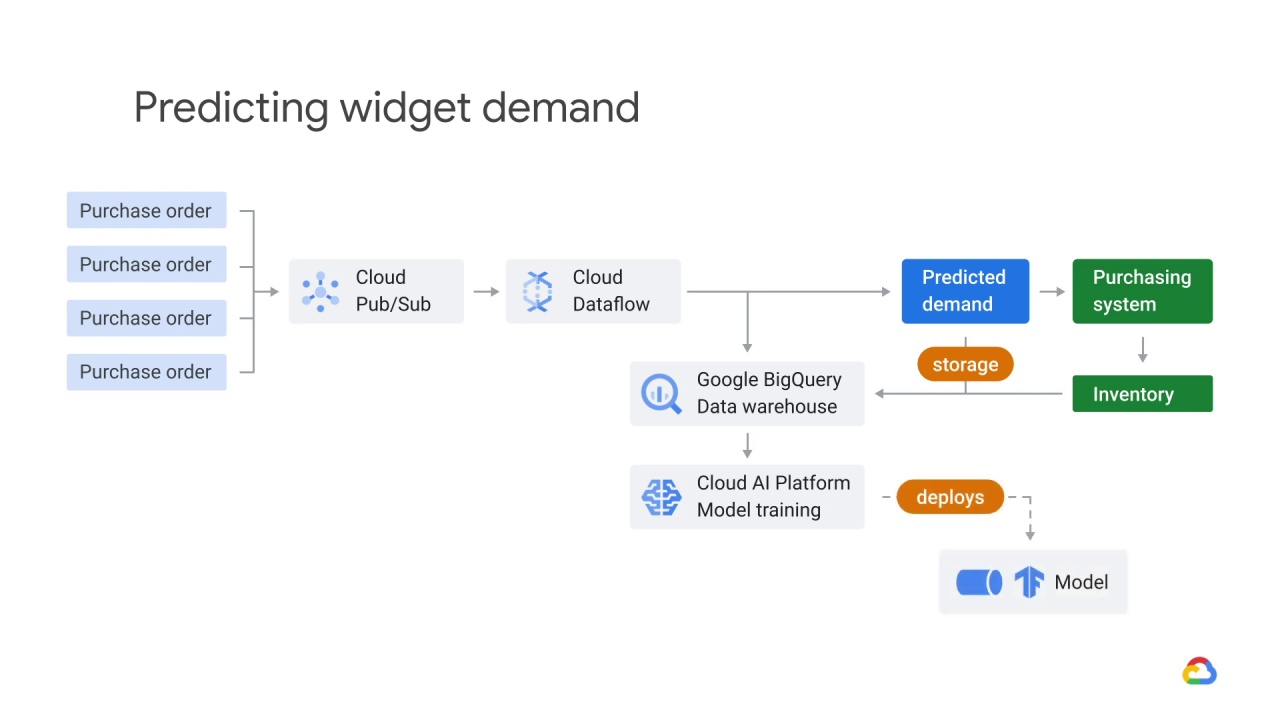
The model is deployed to Cloud AI Platform for training.
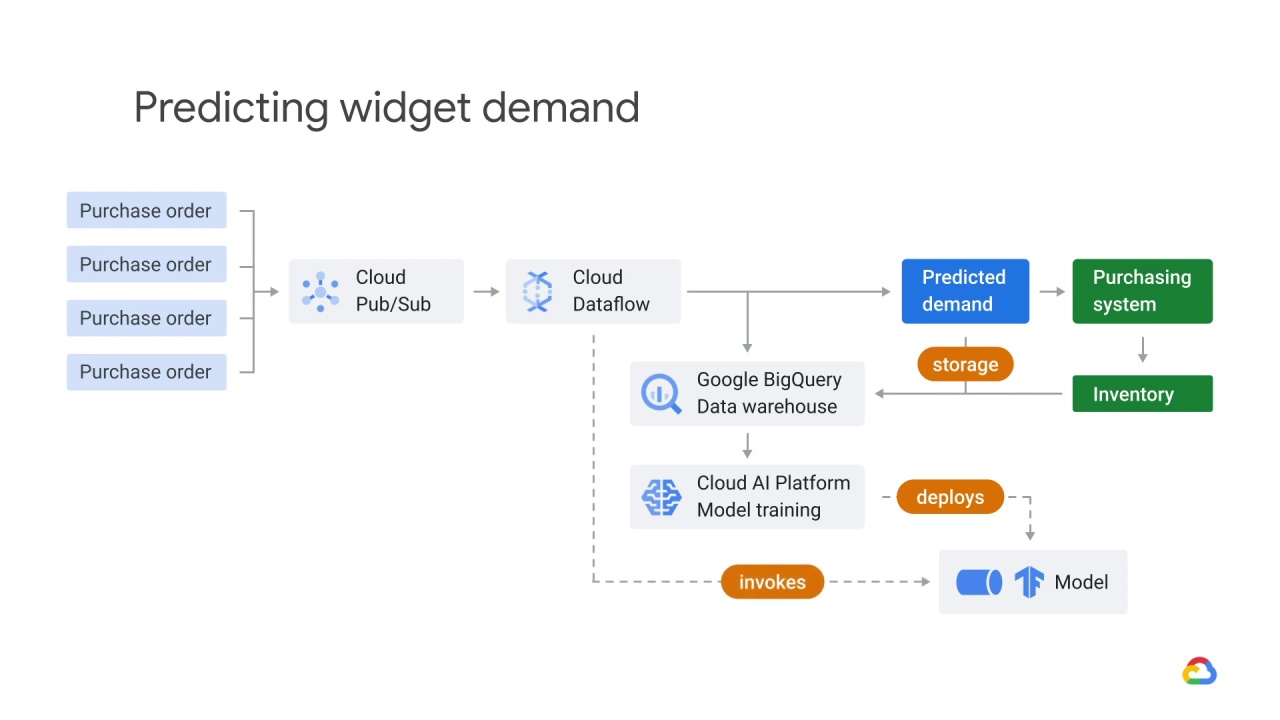
The model can then be invoked on any new or updated data within the Dataflow.
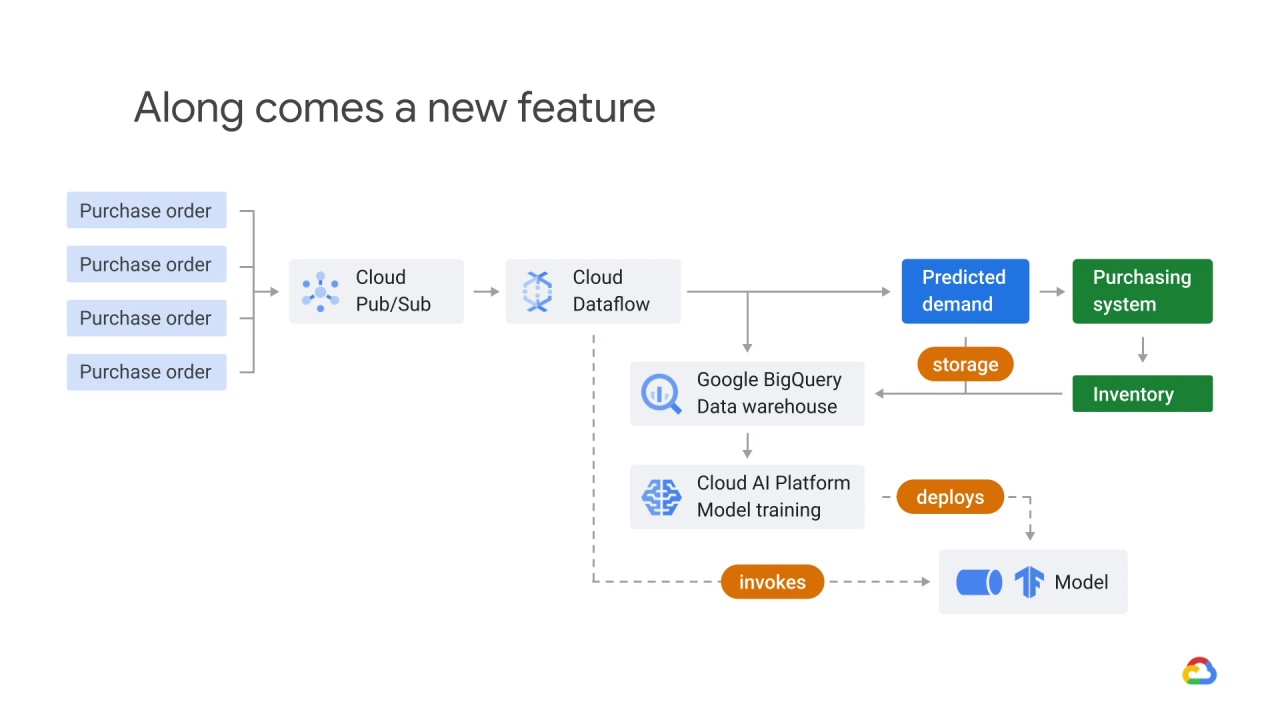
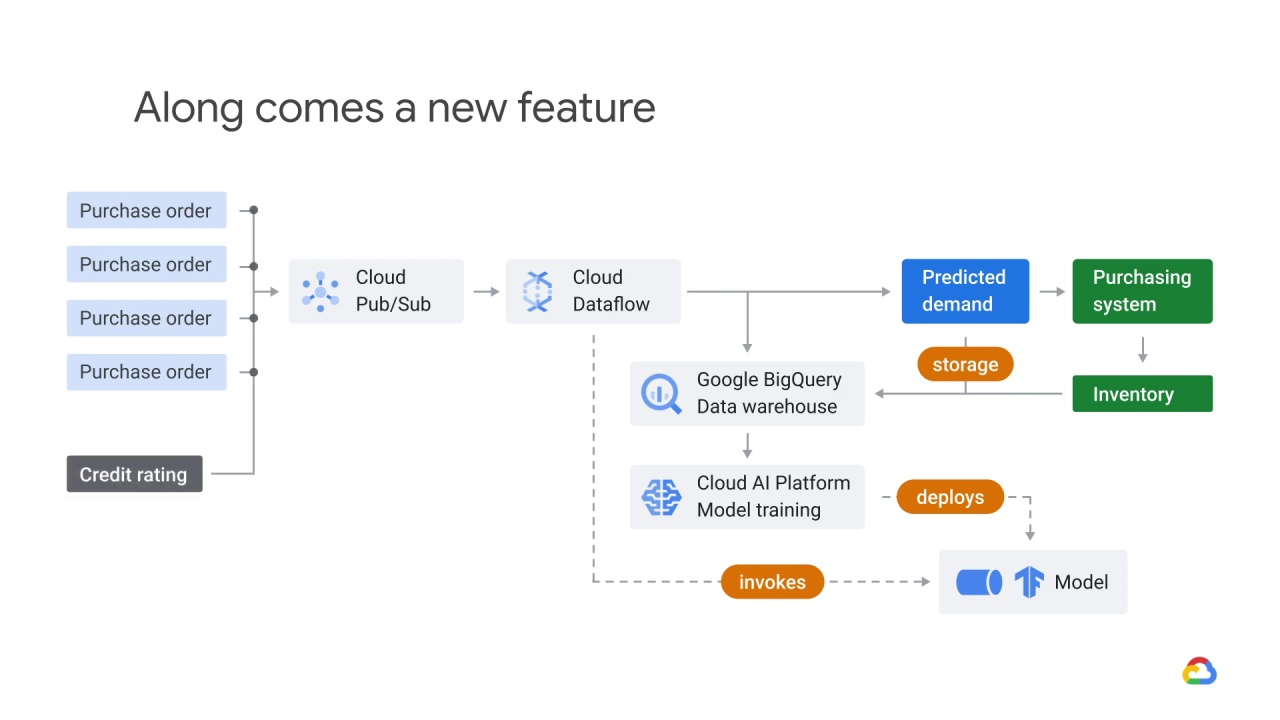
One day, your product manager has the idea to add a credit rating to each purchase order.

You’re the head of the machine learning engineering team.
Do you think it should be added?
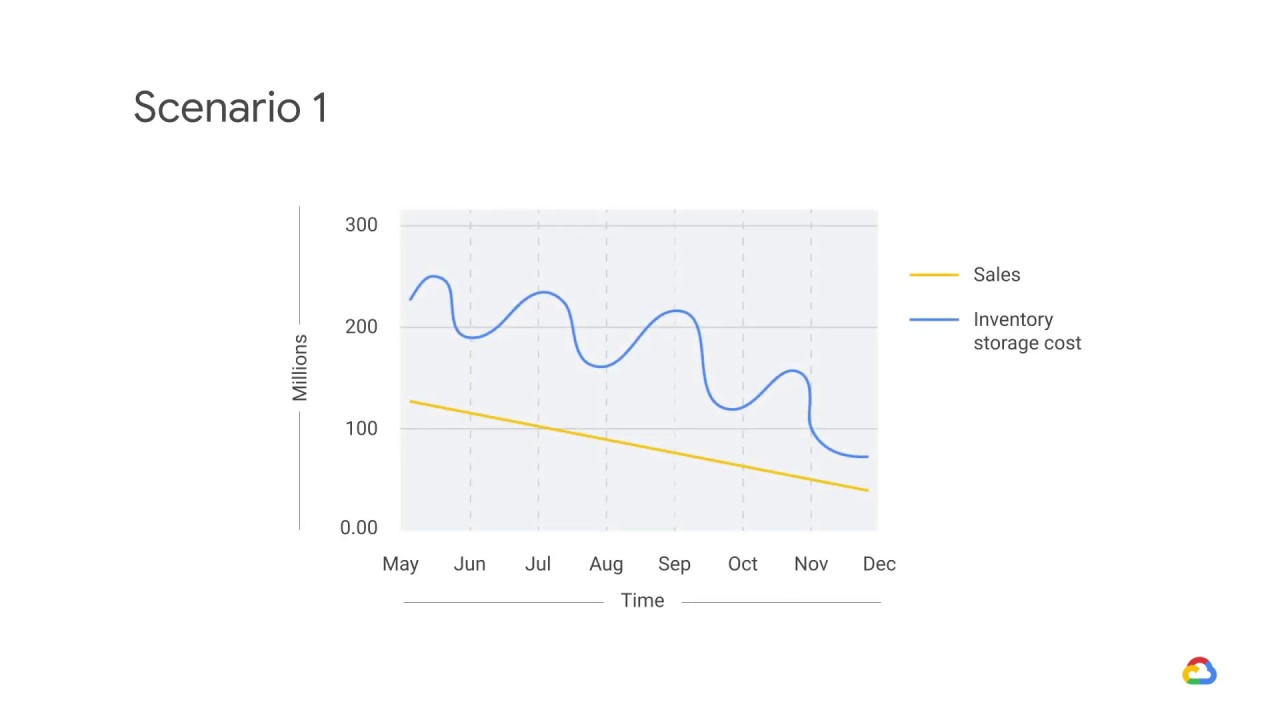
You get an email from the head of the business unit saying that he’s just noticed that sales are down significantly.
The warehouse manager, who is copied on the email, says that inventory storage costs are also down significantly.

The room is suddenly getting quite warm.
What could have happened here?

This is a great example of a feedback loop!
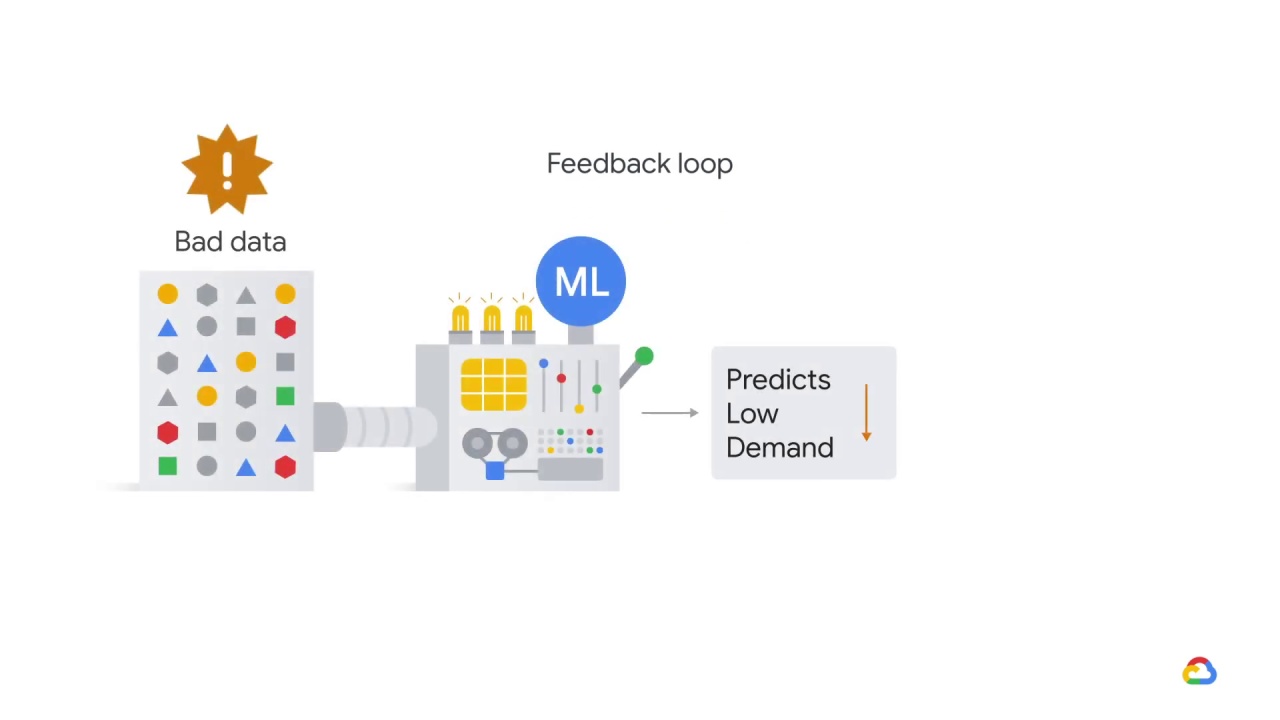
What might have happened was that the model started under predicting demand, perhaps because of some corrupted historical data or an error in the pipeline.
Once demand started to go down
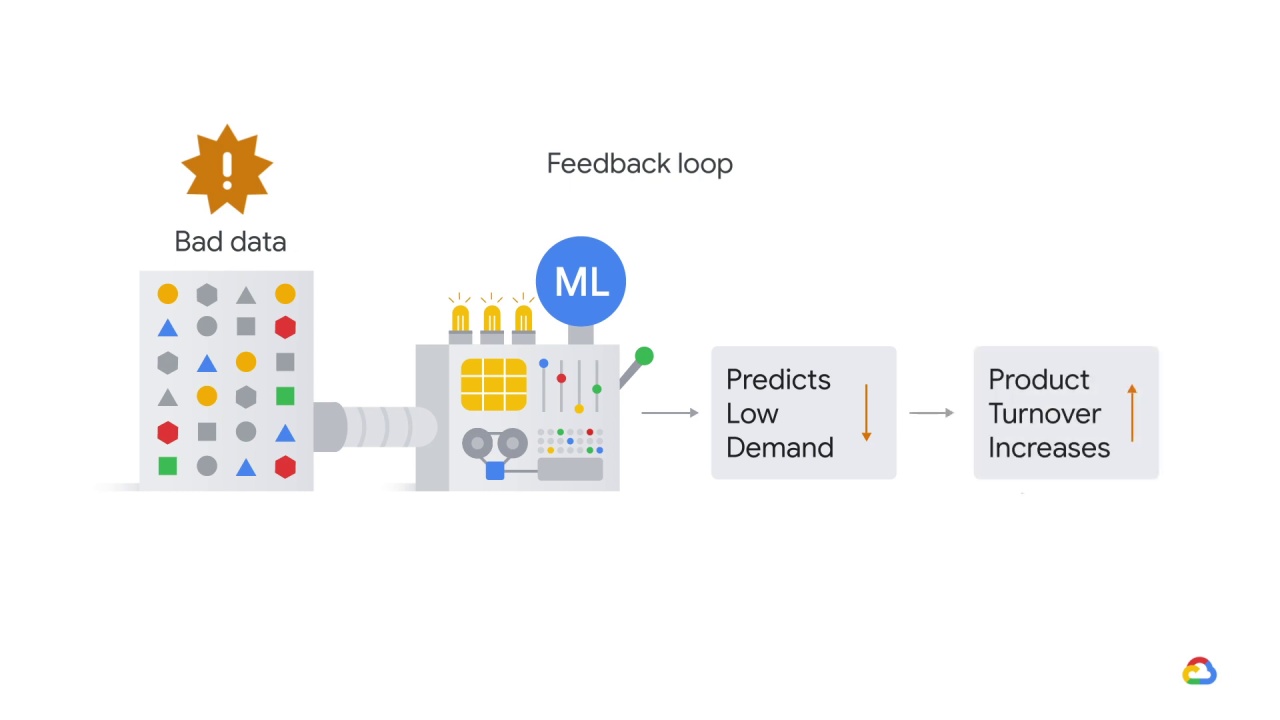
product turnover started to creep up.
If this problem went unnoticed for a while,
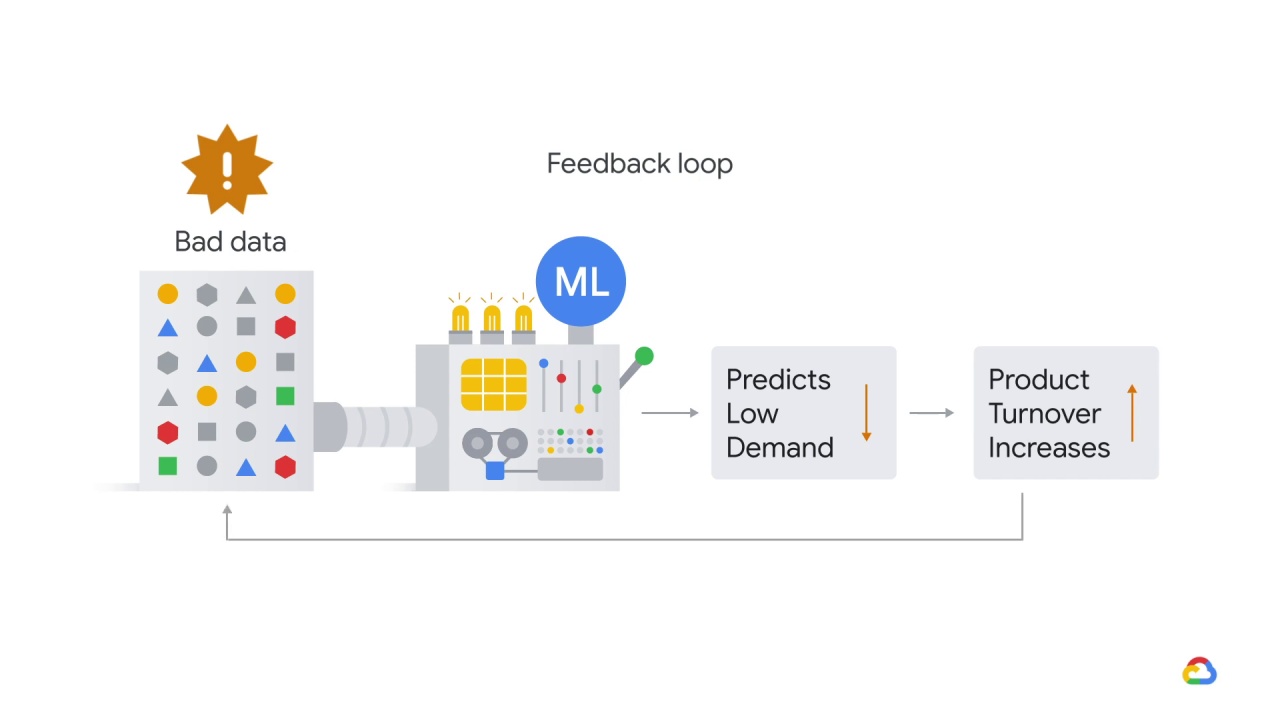
the model might have learned to keep zero inventory all the time!

In addition to being a great reminder that

humans need to stay in the loop, it’s also a reminder that
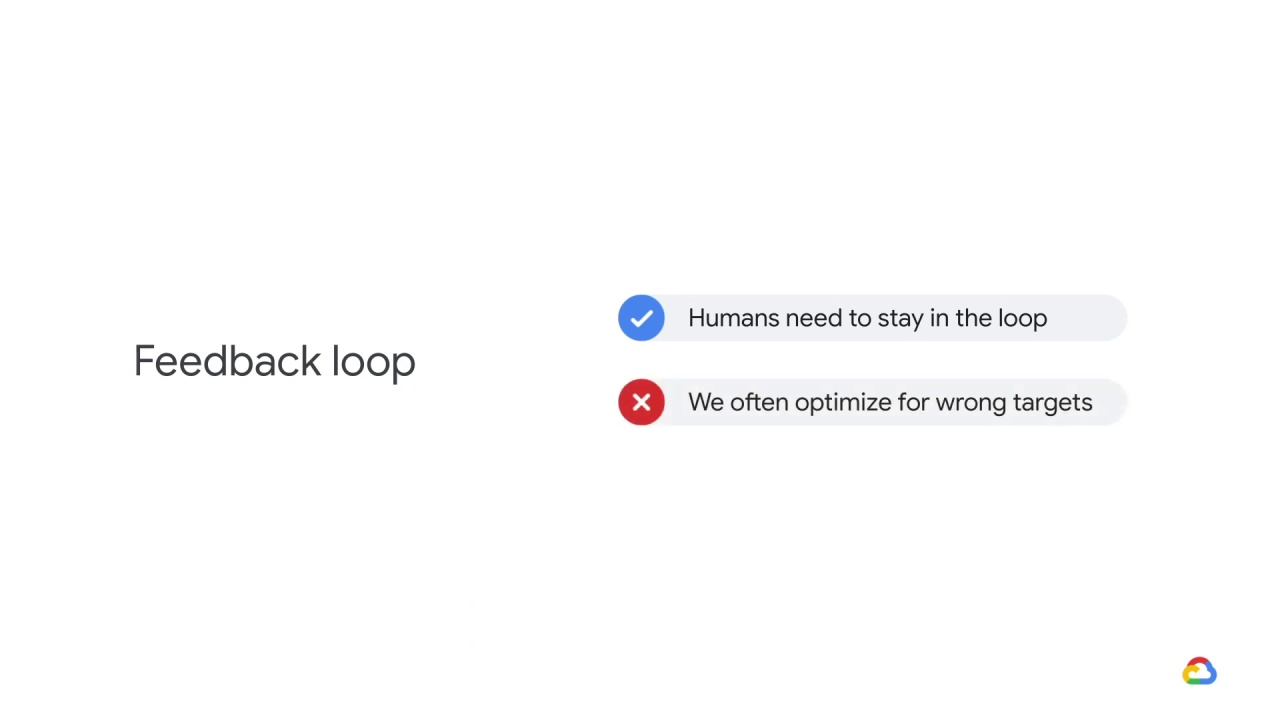
we are often optimizing for something other than what we ultimately care about.
In this case, we were optimizing for matching predicted demand when what we cared about was minimizing carrying costs in order to maximize profits.

Here’s another scenario.
One of your salespeople just shared some amazing news.
By leveraging their contacts at one of Megacorp’s many regional divisions, they signed Megacorp to a five-year deal and it’s the biggest contract yet!

Great, you think
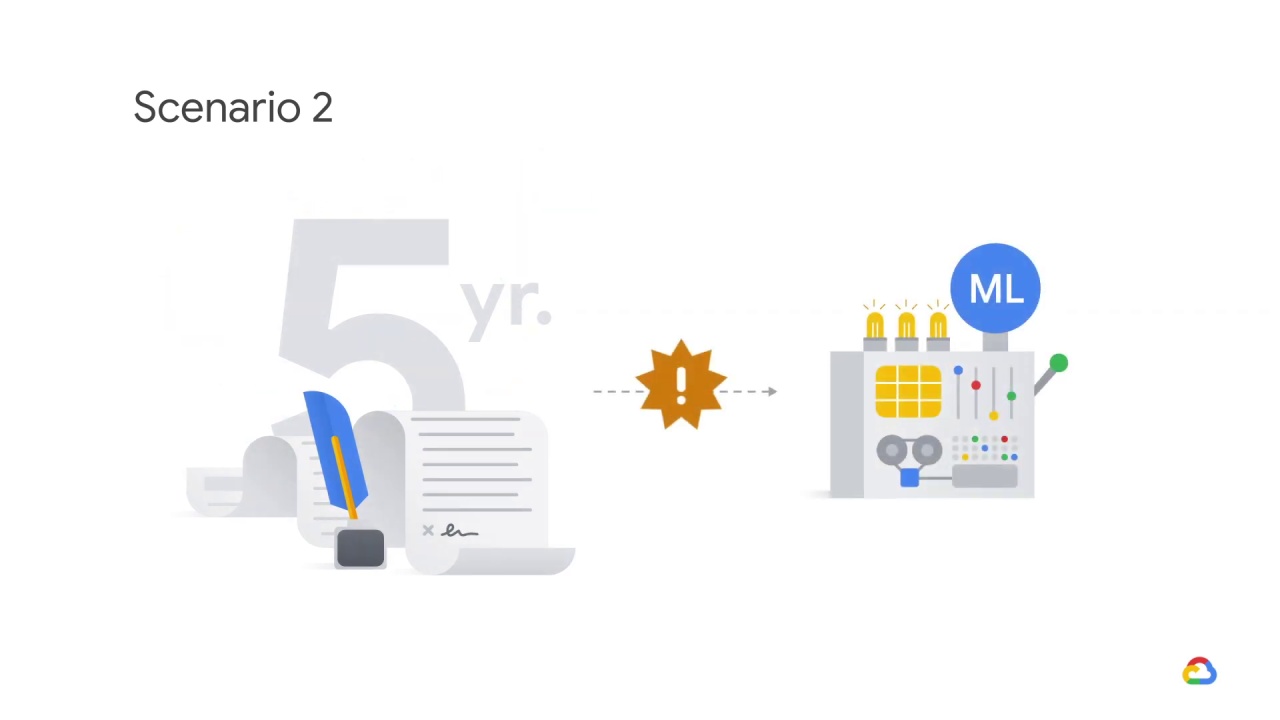
not realizing that this could have implications for your model’s performance.

How can these be related?
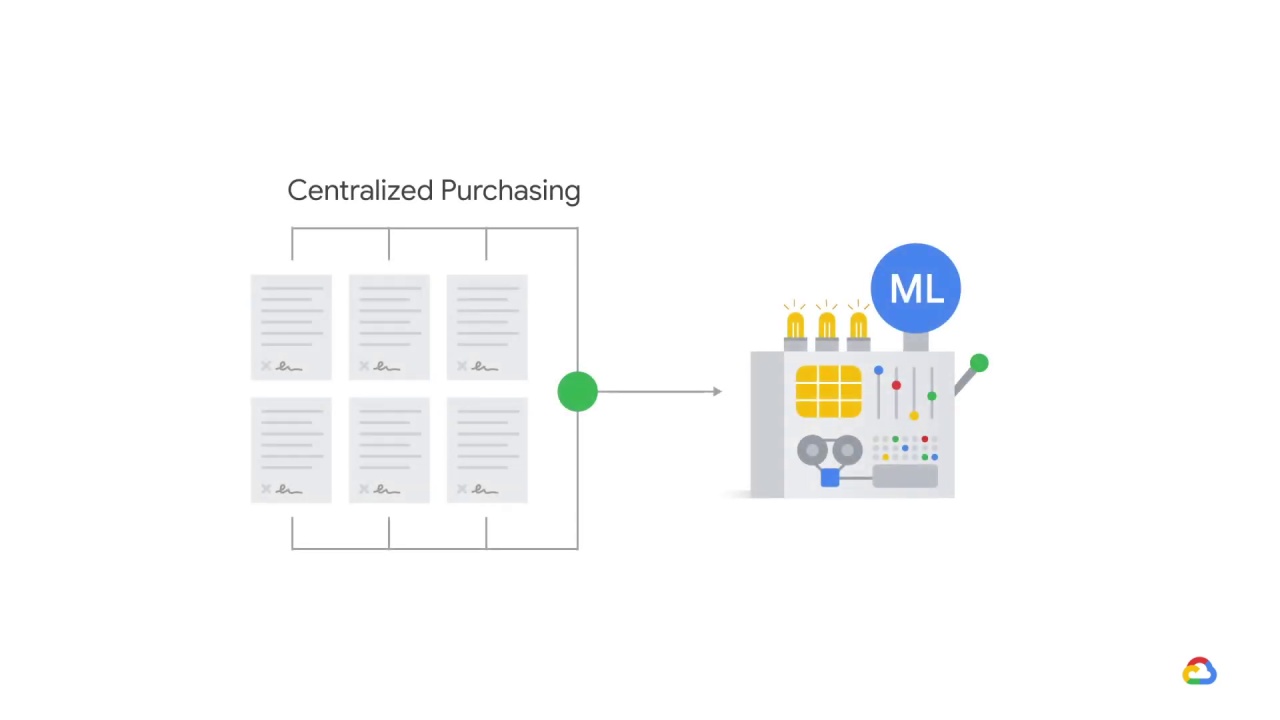
It all depends on how the sales orders come in, and how independent the divisions actually are.
If the divisions are entirely dependent (because there’s actually just one purchasing decision, split up by division) and these orders come in separately, your model may still treat these orders as independent, in which case it would look much more compelling as evidence of an uptick in demand.
The solution here would be to add
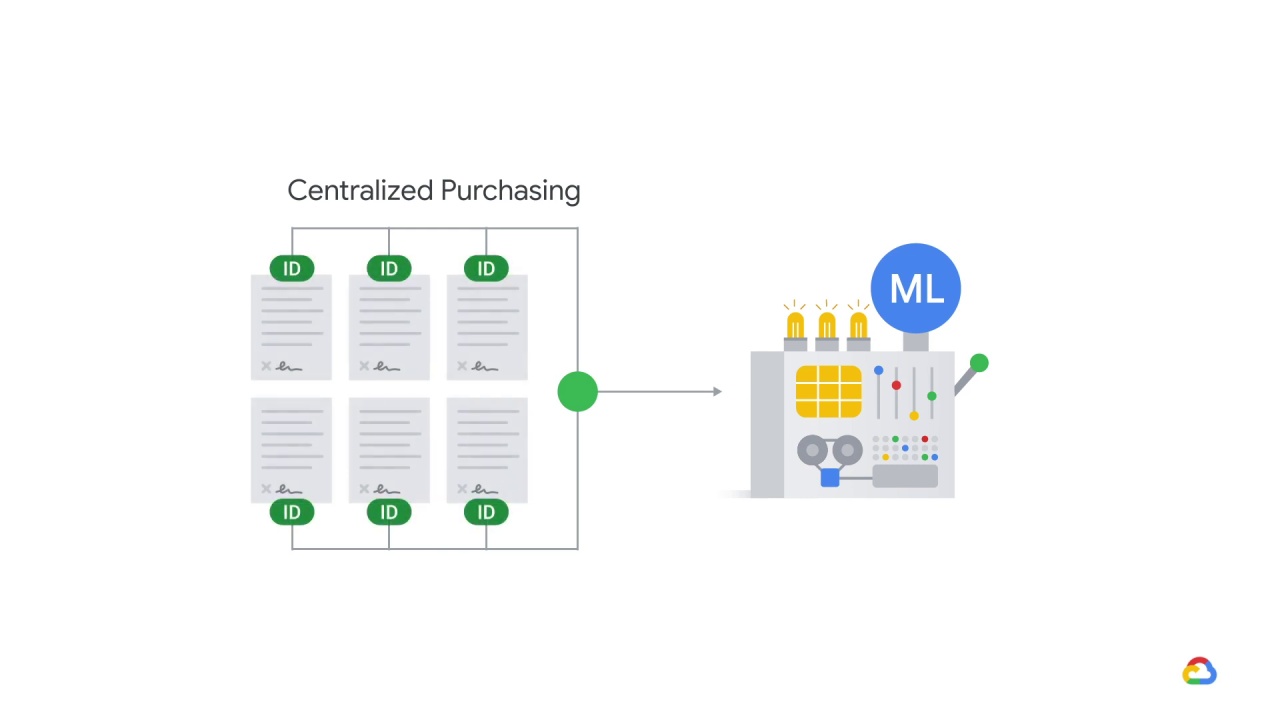
some aggregation by company ID in your pipeline before computing other statistics.

Okay, let’s look at one last scenario. Your warehouse manager emails you and tells you that the warehouse flooded and they’ve had to scrap a large portion of the inventory.

They’ve ordered replacements from purchasing,
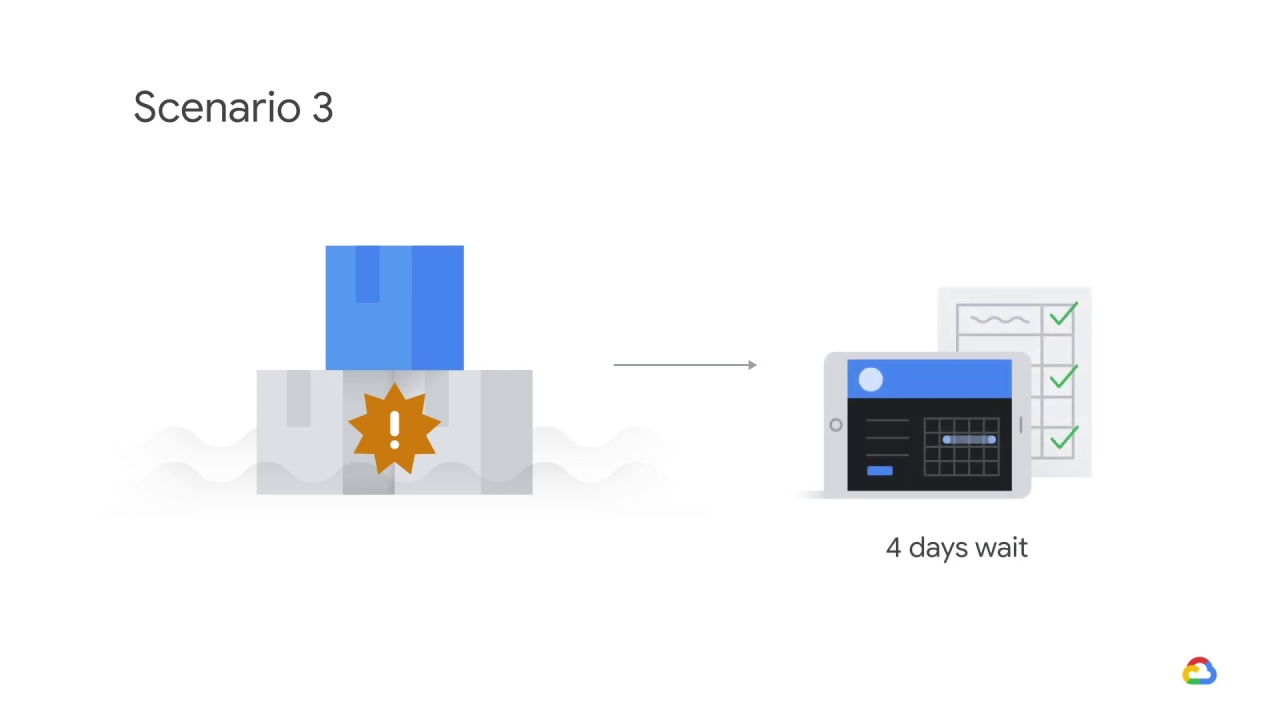
but it will be four days before those arrive and unfulfilled orders in the meantime will have to wait.
You realize that you have the skills to address this problem.

What do you do?
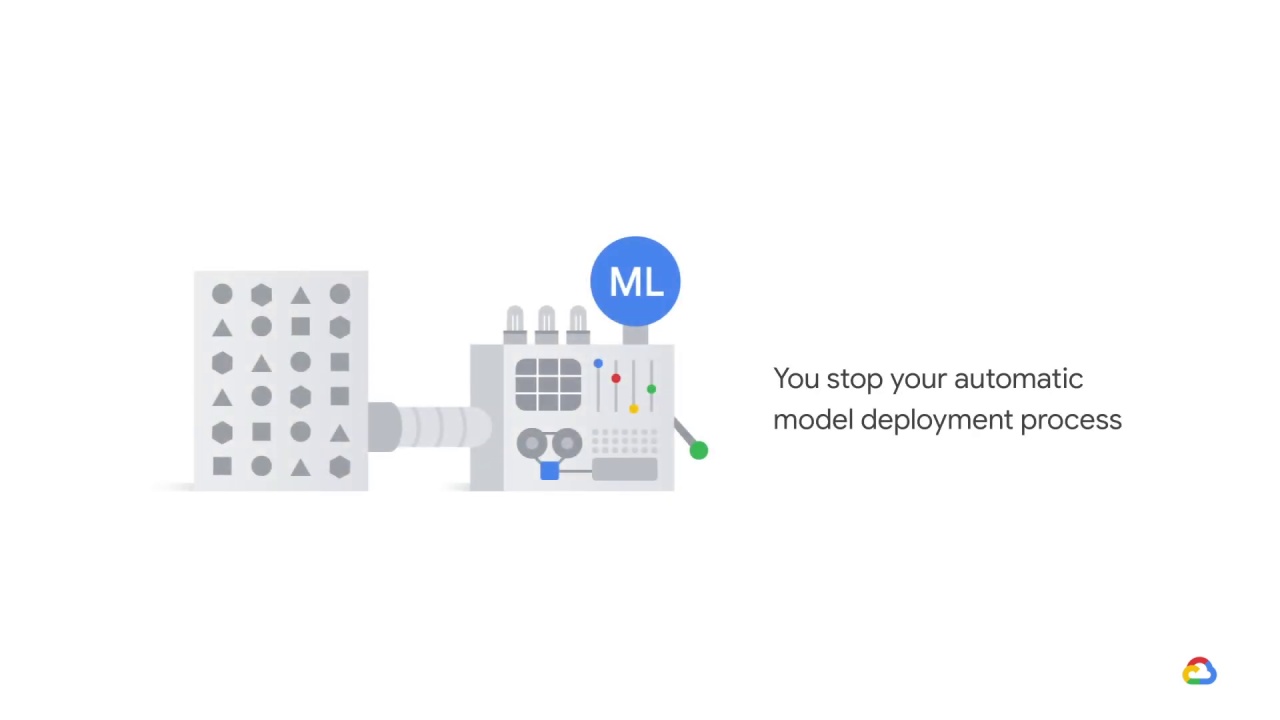
You stop your automatic model deployment process.
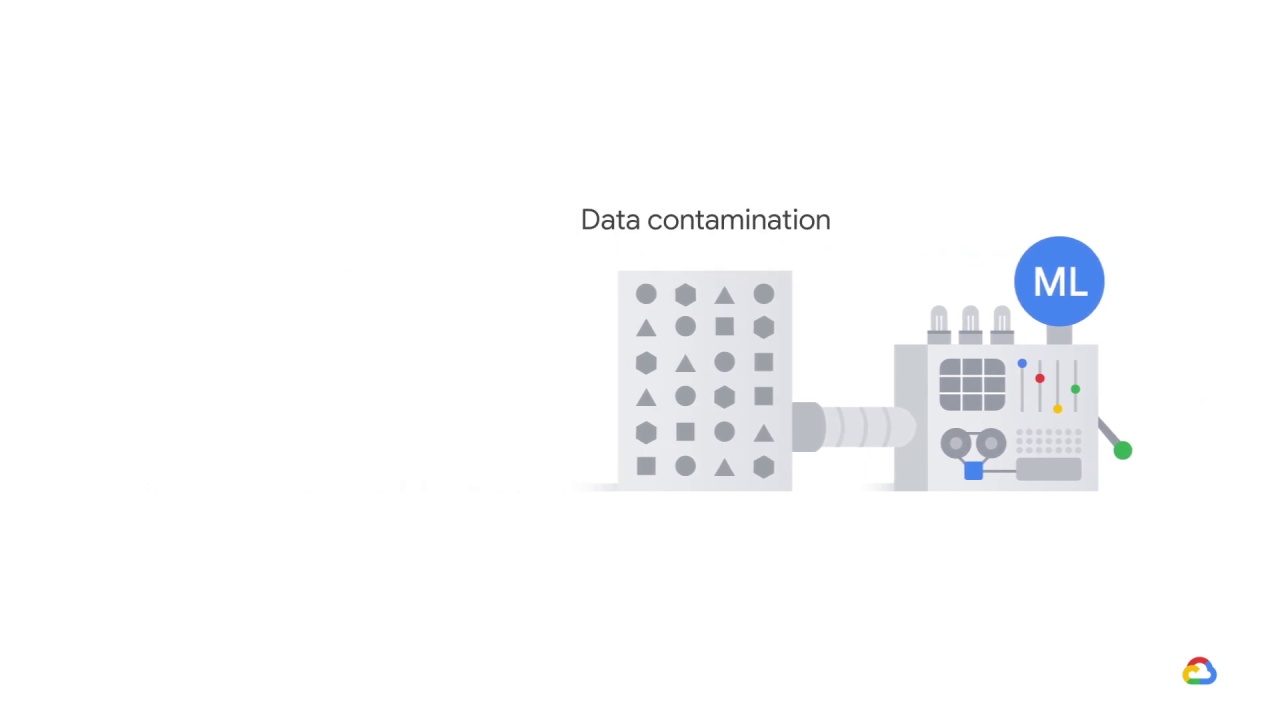
The reason you do so is because data collected during this period will be contaminated.
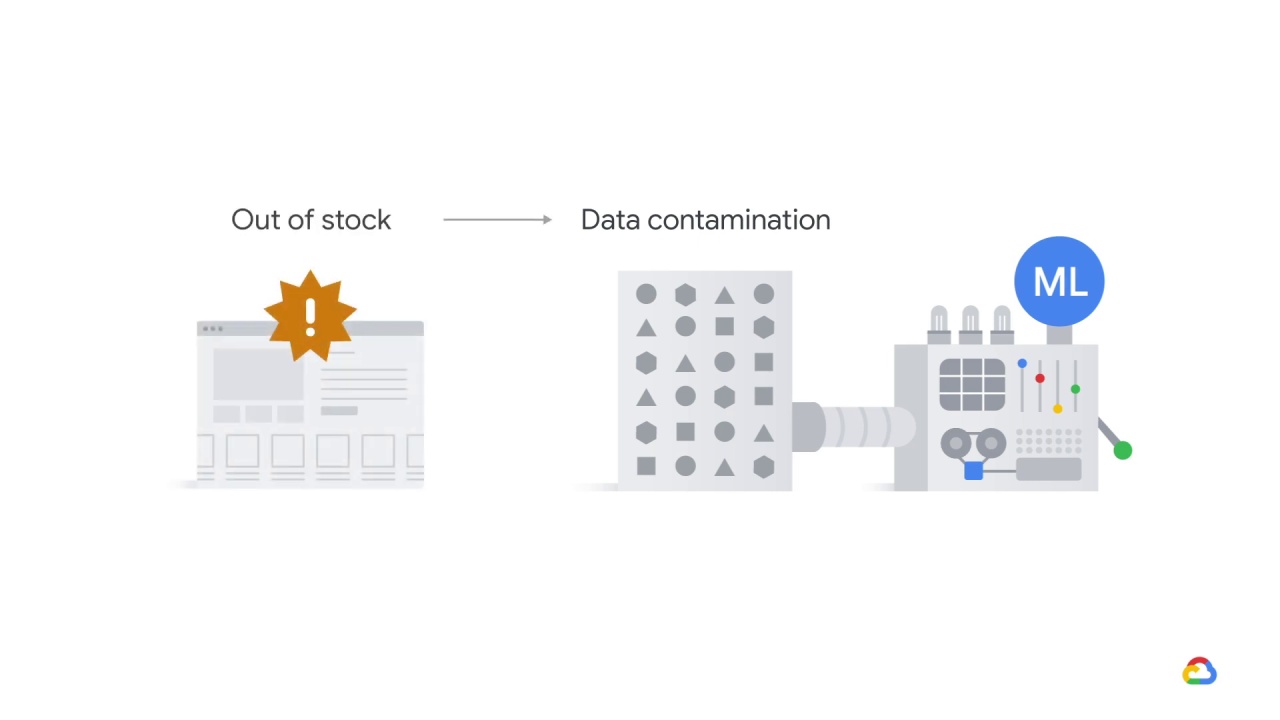
Since the products will show as out of stock on the website, customer orders will be low.