Changing distributions

Earlier you saw how, in the context of ingesting an upstream model,
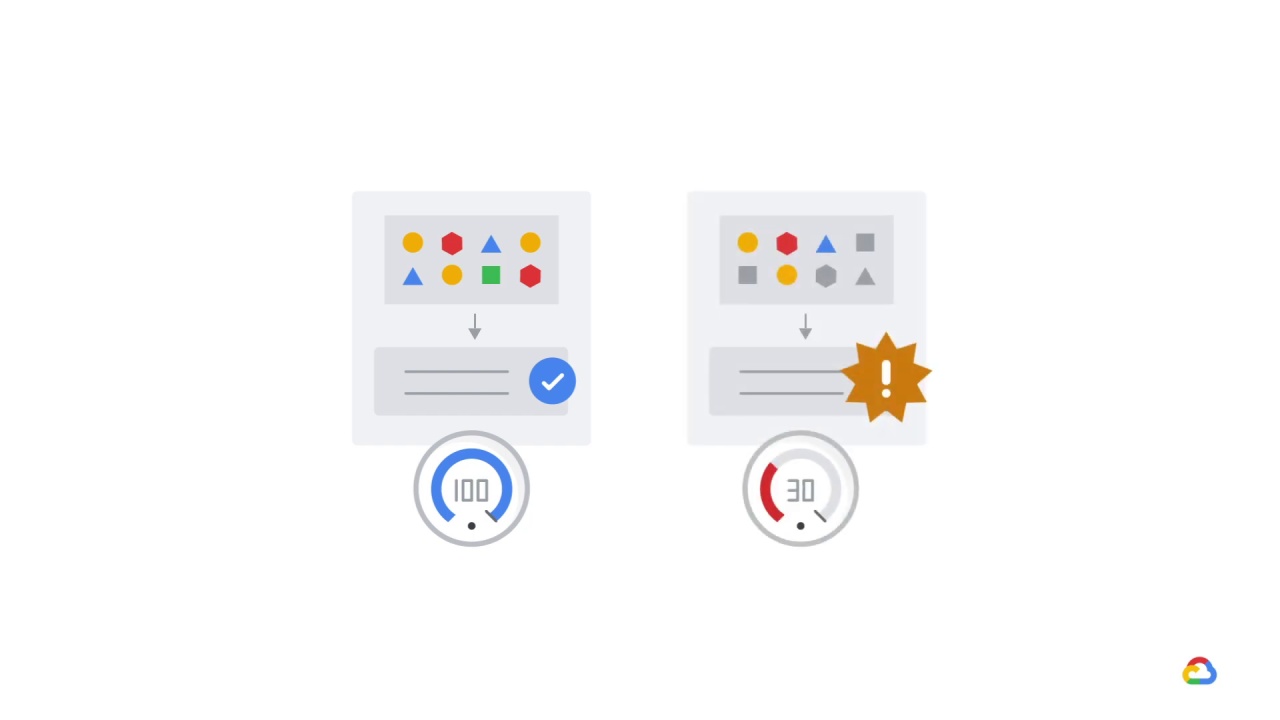
our model’s performance would degrade if it expected one input but ingested another.
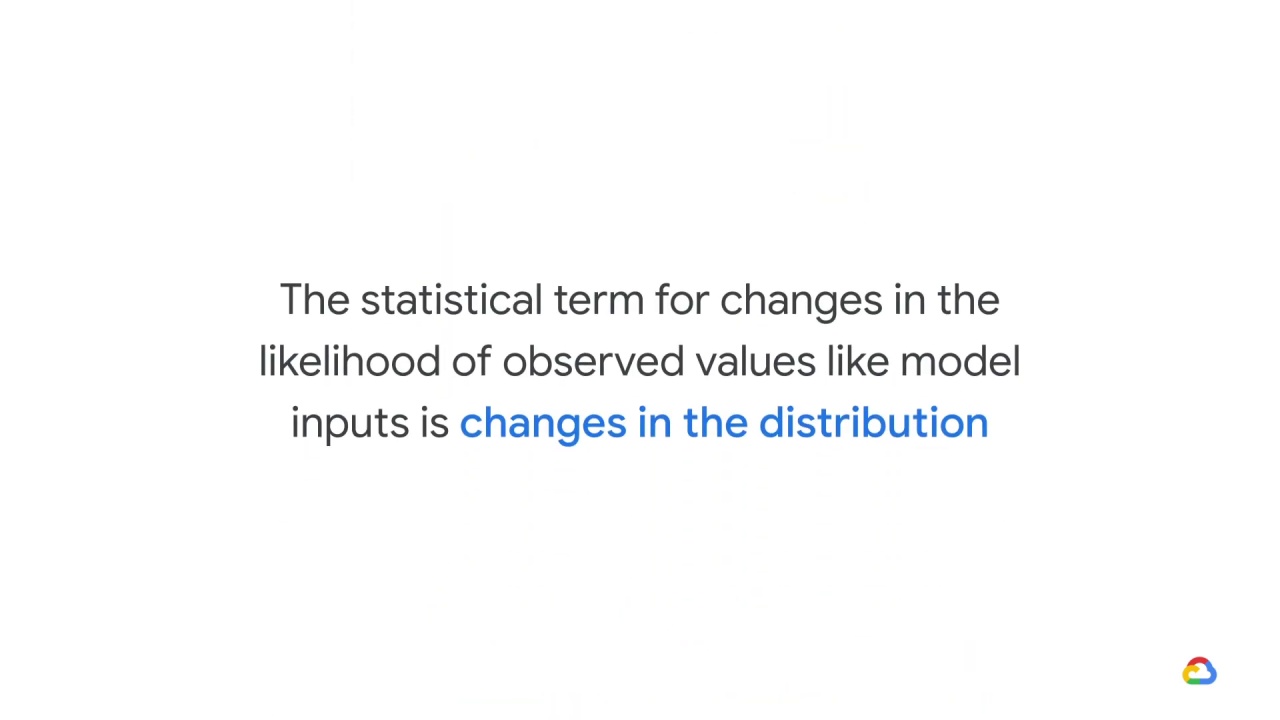
The statistical term for changes in the likelihood of observed values like model inputs is changes in the distribution.
And it turns out that the distribution of the data can change for all sorts of reasons.
For example, sometimes the distribution of the label changes.
We’ve looked at the natality dataset in BigQuery
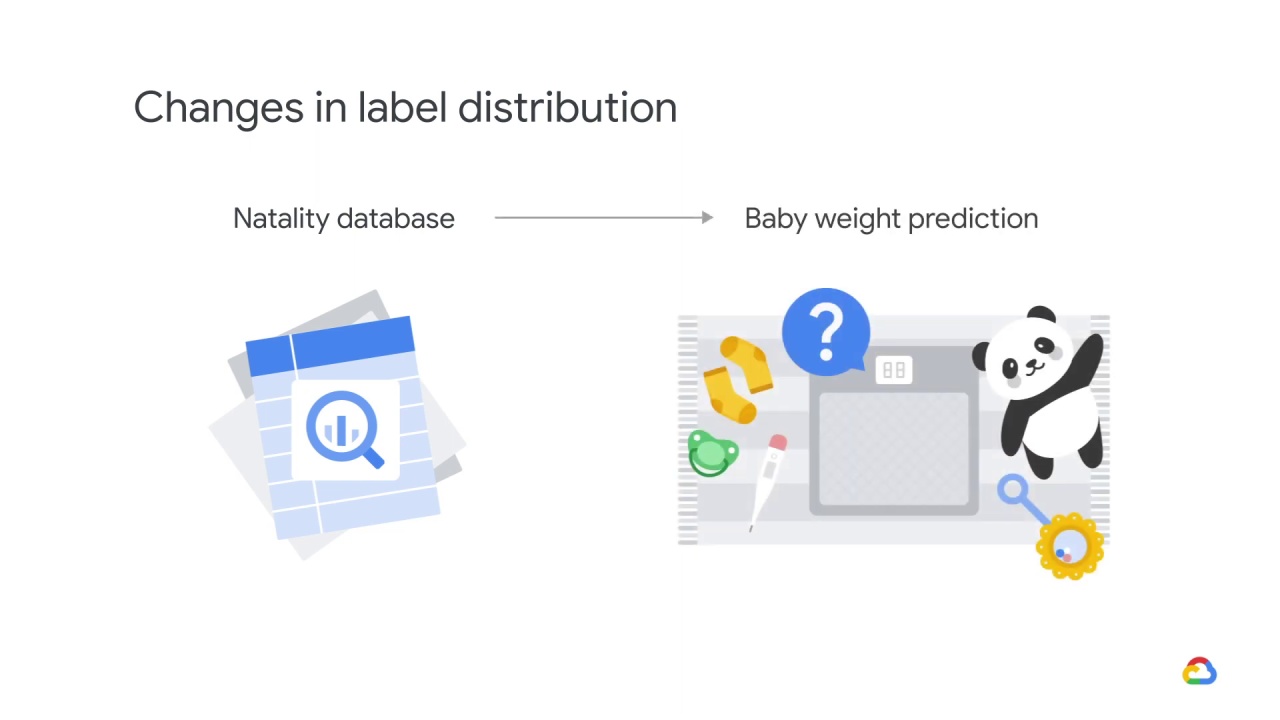
and tried to predict baby weight.
Baby weight has actually changed over time.
It peaked in the 1980s and has since been declining.
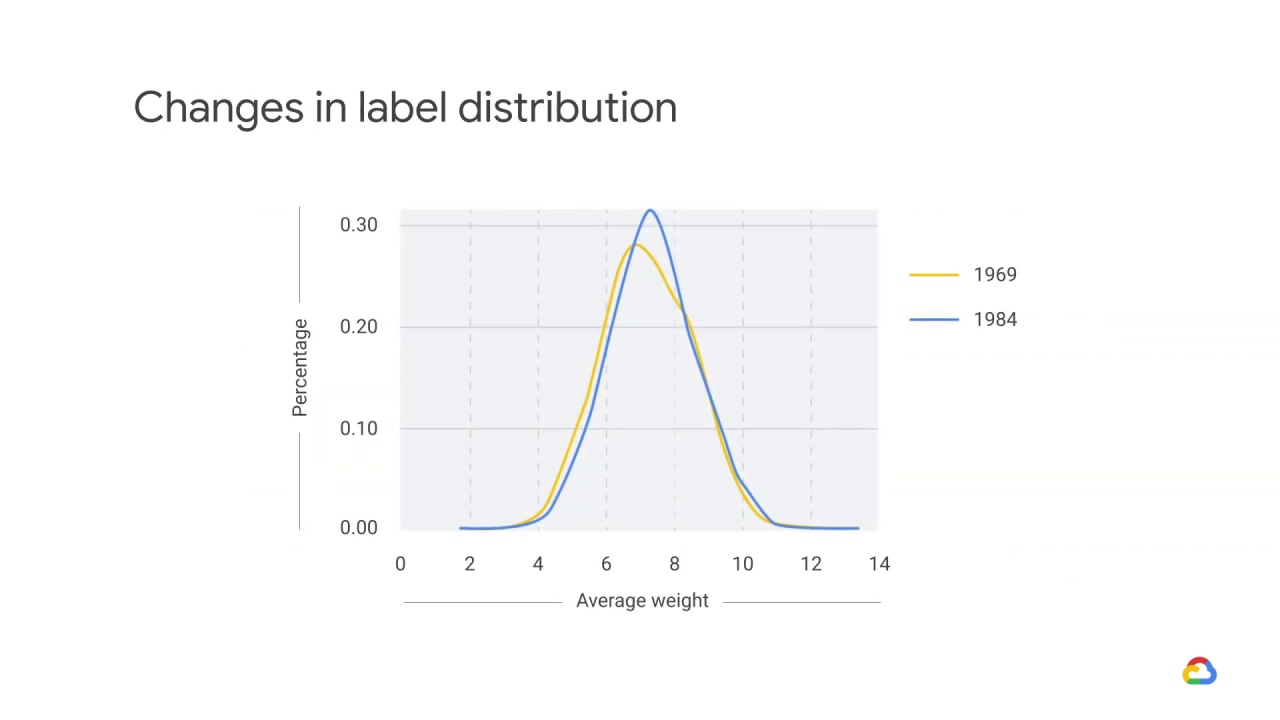
In 1969, babies weighed significantly less than they did in 1984.
When the distribution of the label changes, it could mean that the relationship between features and labels is changing as well.
At the very least, it’s likely that our model’s predictions, which will typically match the distribution of the labels in the training set, will be significantly less accurate.
However, sometimes it’s not the labels,
but the features, that change their distribution.
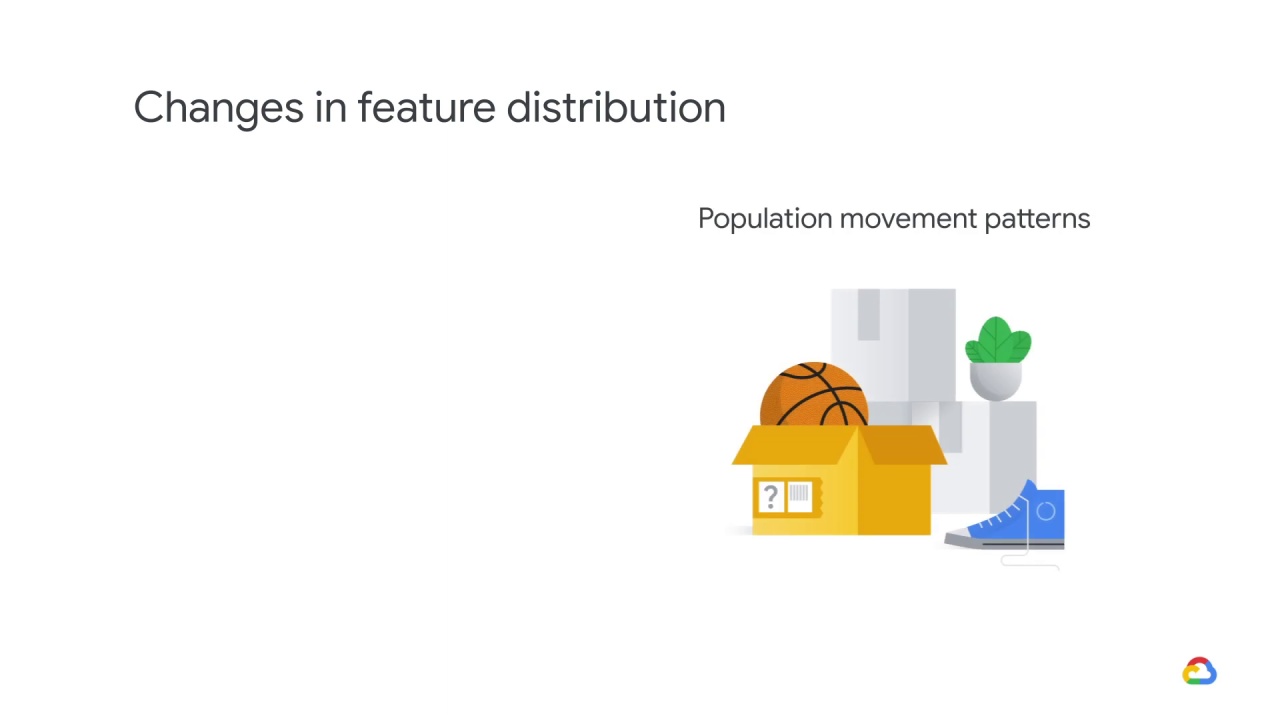
For example, say you’ve trained your model to predict population movement patterns
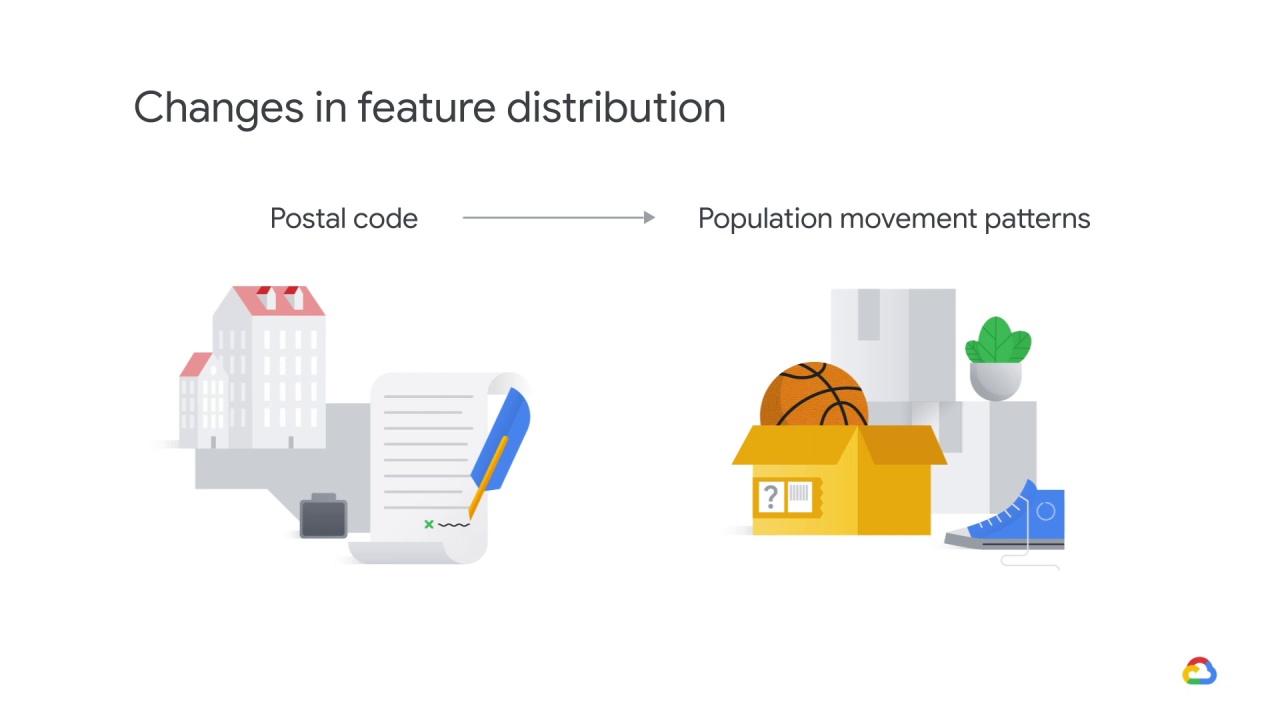
using postal code as a feature.
Surprisingly, postal codes aren’t fixed.
Every year, governments release new ones and deprecate old ones.
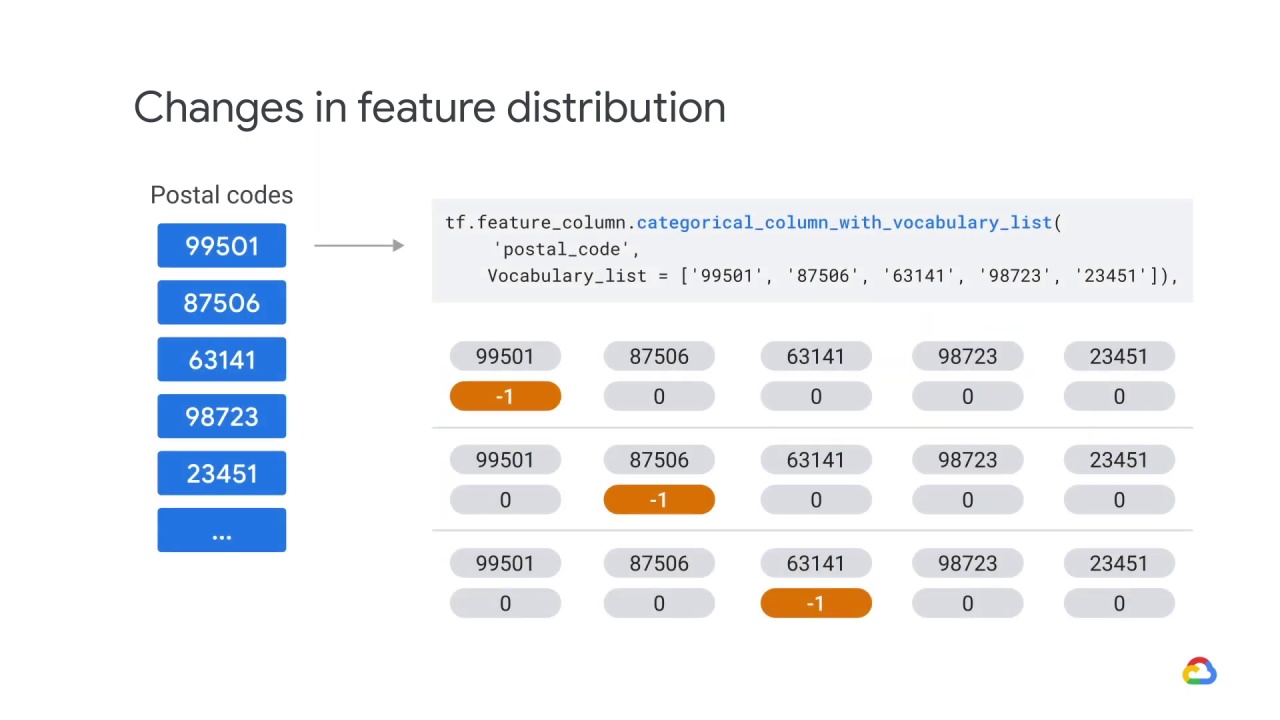
Now as a ML practitioner, you know that postal codes aren’t really numbers.
So you’ve chosen to represent them as categorical feature columns, but this might lead to problems.
If you chose to specify a vocabulary, but set the number of out of vocab buckets to 0, and didn’t specify a default, then the distribution may become skewed toward the default value, which is -1.
And this might be problematic because the model may be forced to make predictions in regions of the feature space which were not well represented in the training data.
There’s another name for when models are asked to make predictions on points in feature space that are far away from the training data,
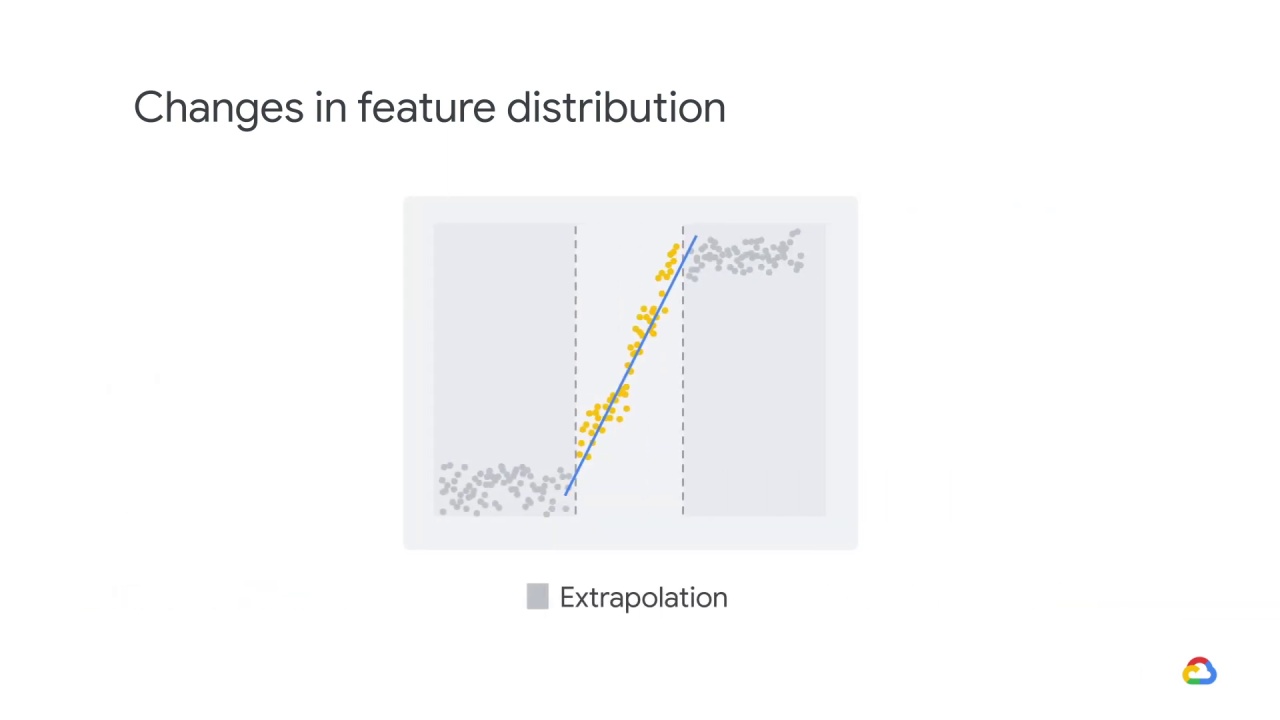
and that’s extrapolation.
Extrapolation means to generalize outside the bounds of what we’ve previously seen.
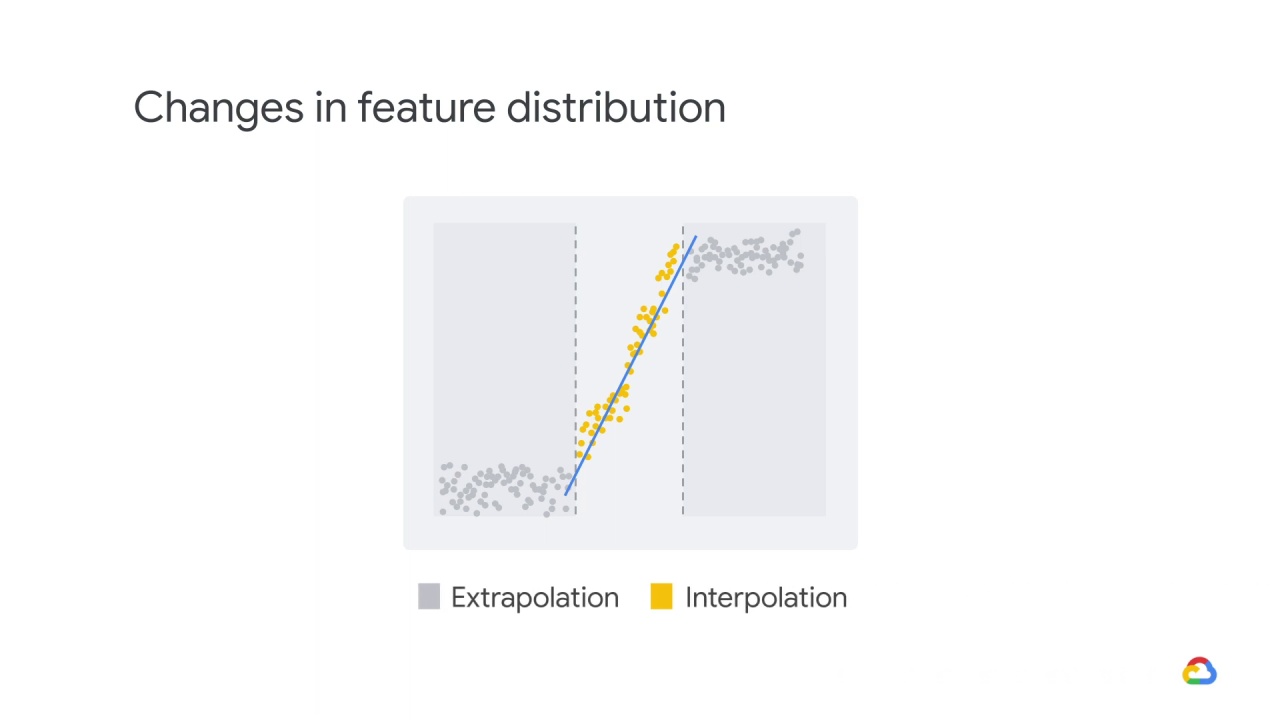
Interpolation is the opposite.
It means to generalize within the bounds of what we’ve previously seen.
Interpolation is always much easier.
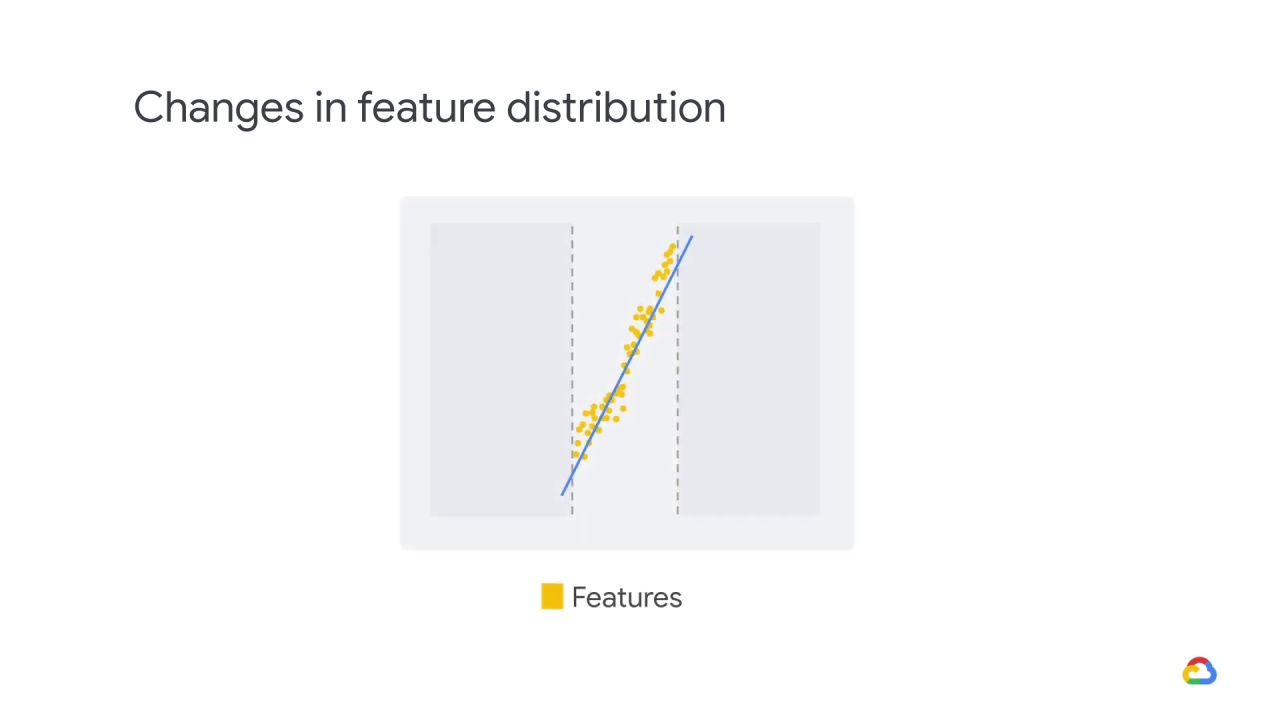
For example, let’s say that the model got to see the yellow data and not the gray data.
The blue line reflects a linear regression on the yellow data.
Predictions in the yellow region are interpolated and reasonably accurate.
In contrast, predictions in the gray region are extrapolated and are increasingly inaccurate the farther we get from the yellow region.
You can protect yourself from changing distributions using a few different methods.
The first thing you can do is

be vigilant through monitoring.
You can look at the descriptive summaries of your inputs,
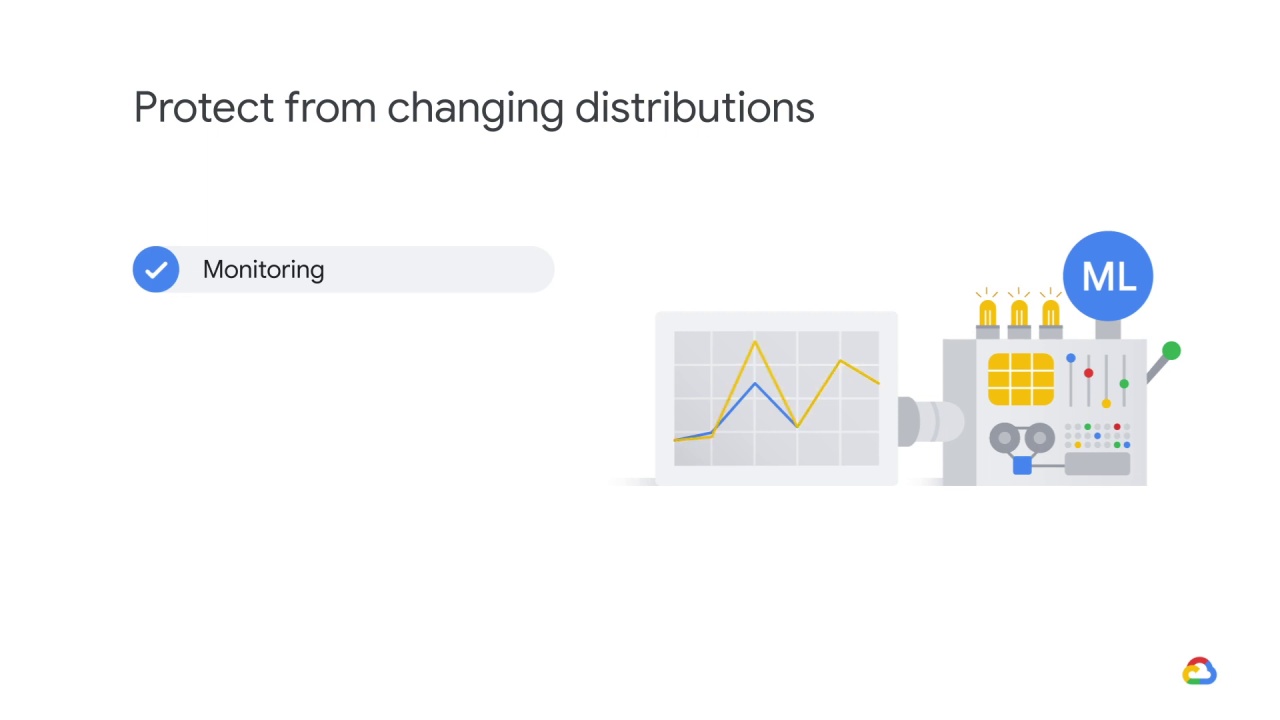
and compare them to what the model has seen.
If, for example, the mean or the variance has changed substantially,
then you can analyze this new segment of the input space, to see if the relationships learned still hold.
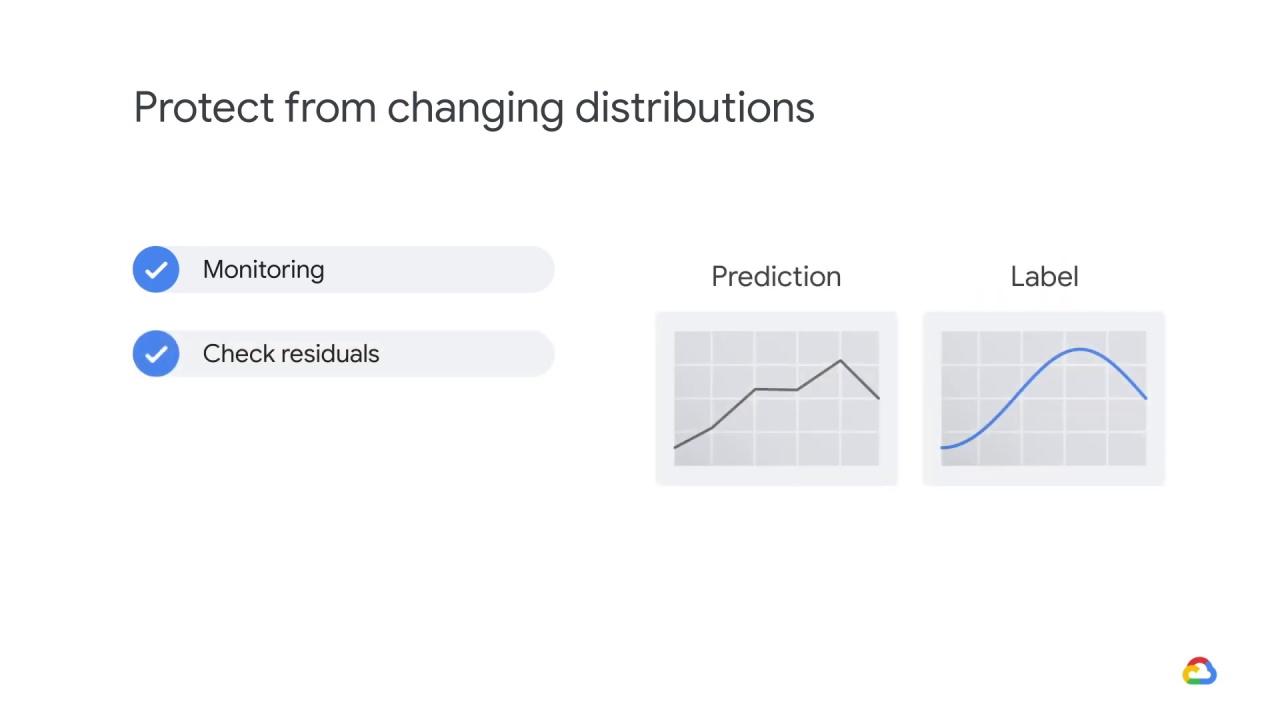
You can also look to see whether the model’s residuals, that is the
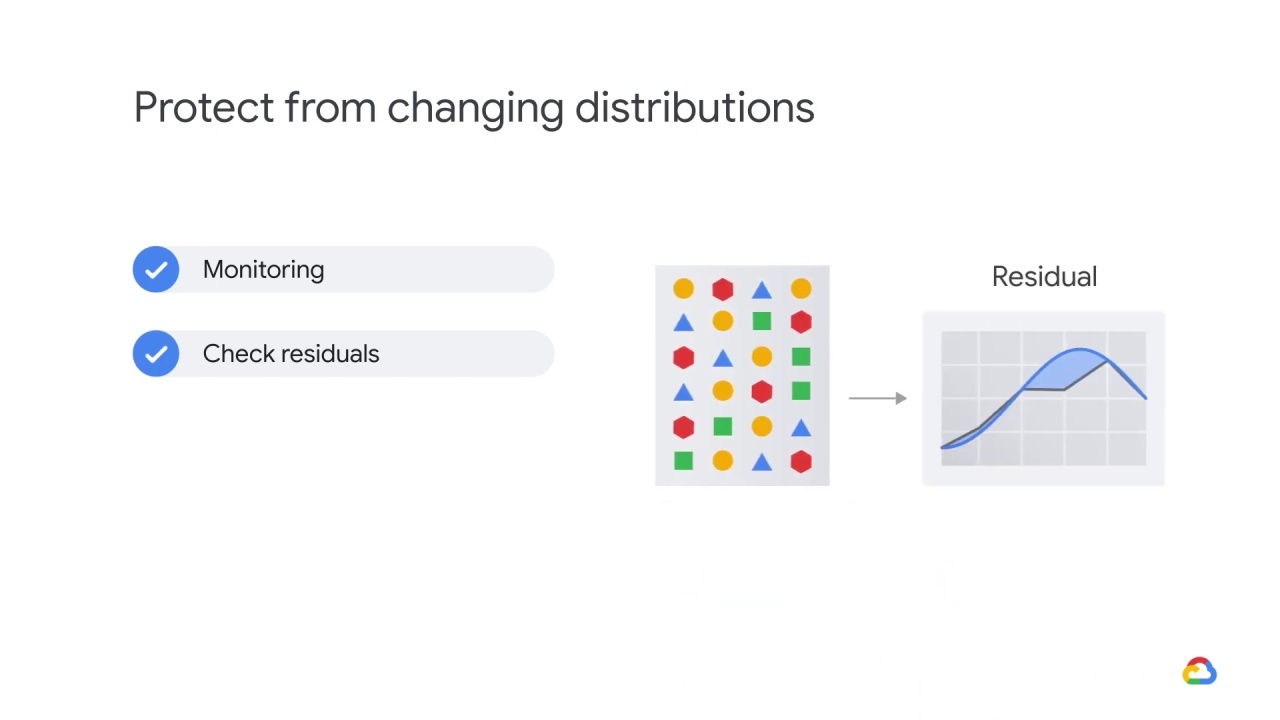
difference between its predictions and the labels, has changed as a function of your inputs.
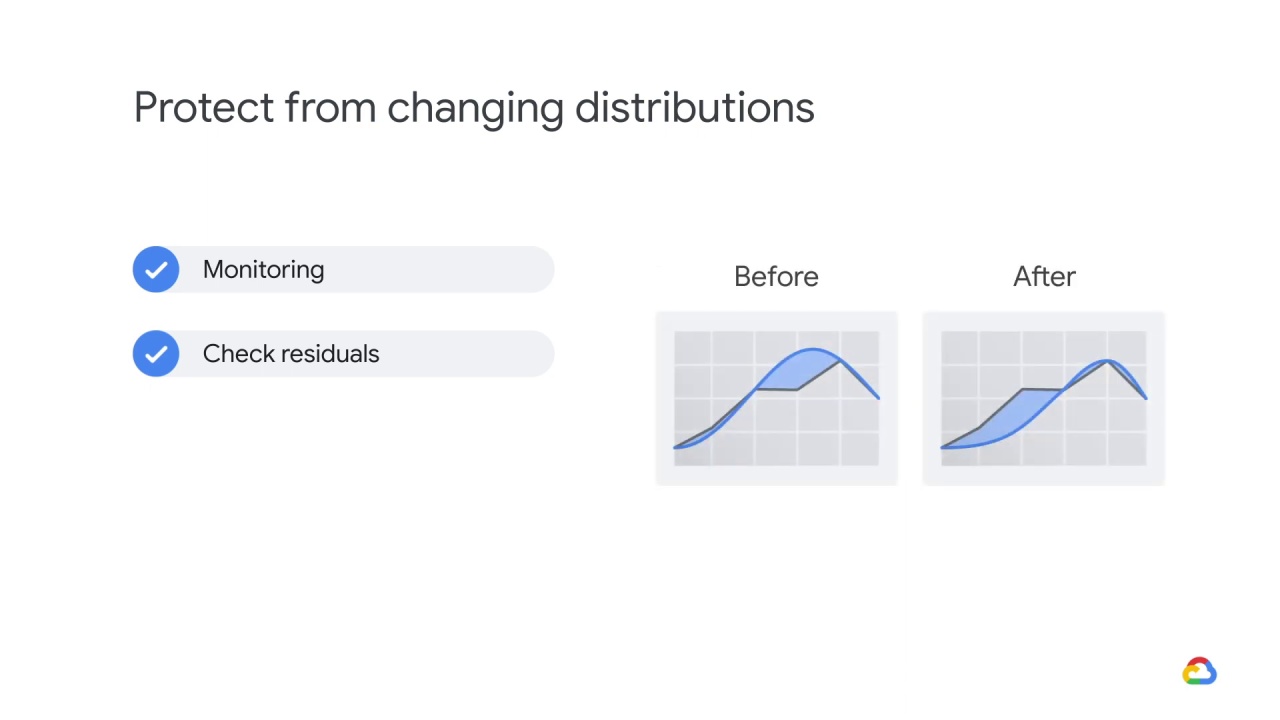
If, for example, you used to have small errors at one slice of the input and large in another, and now it’s switched, this could be evidence of a change in the relationship.
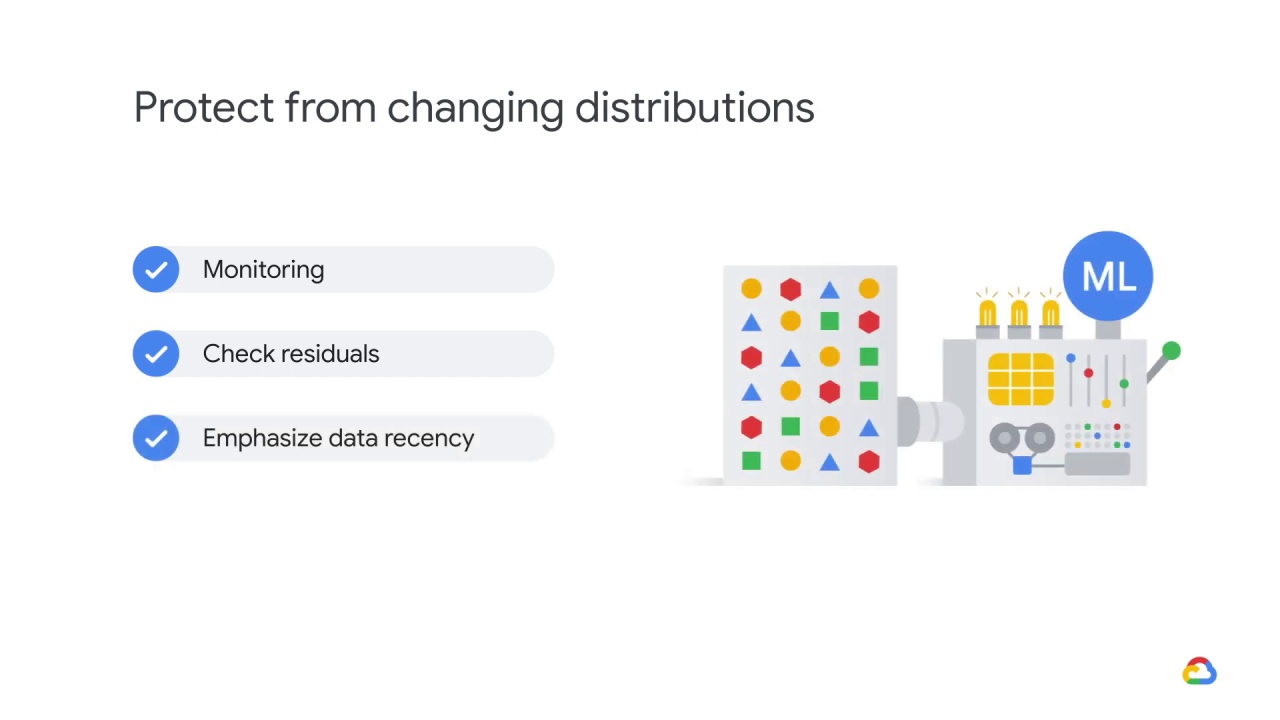
Finally, if you have reason to believe that the relationship is changing over time,
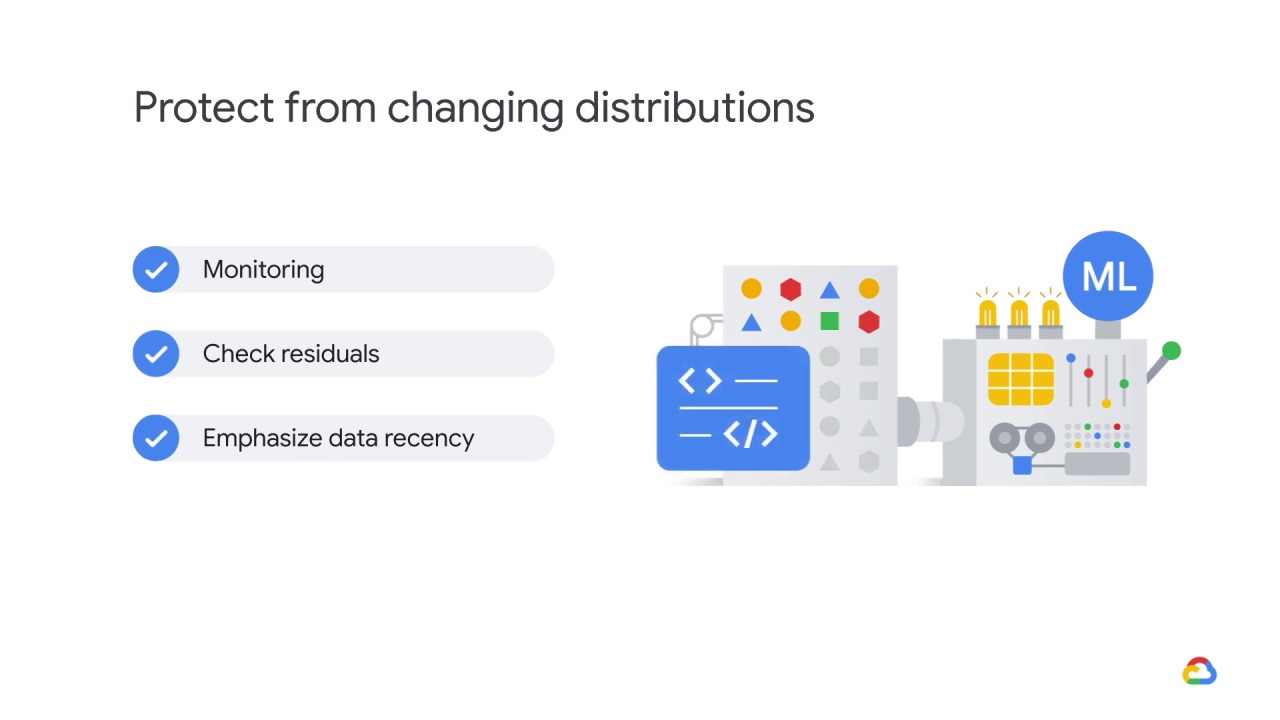
you can force the model to treat more recent observations as more important by writing a custom loss function,
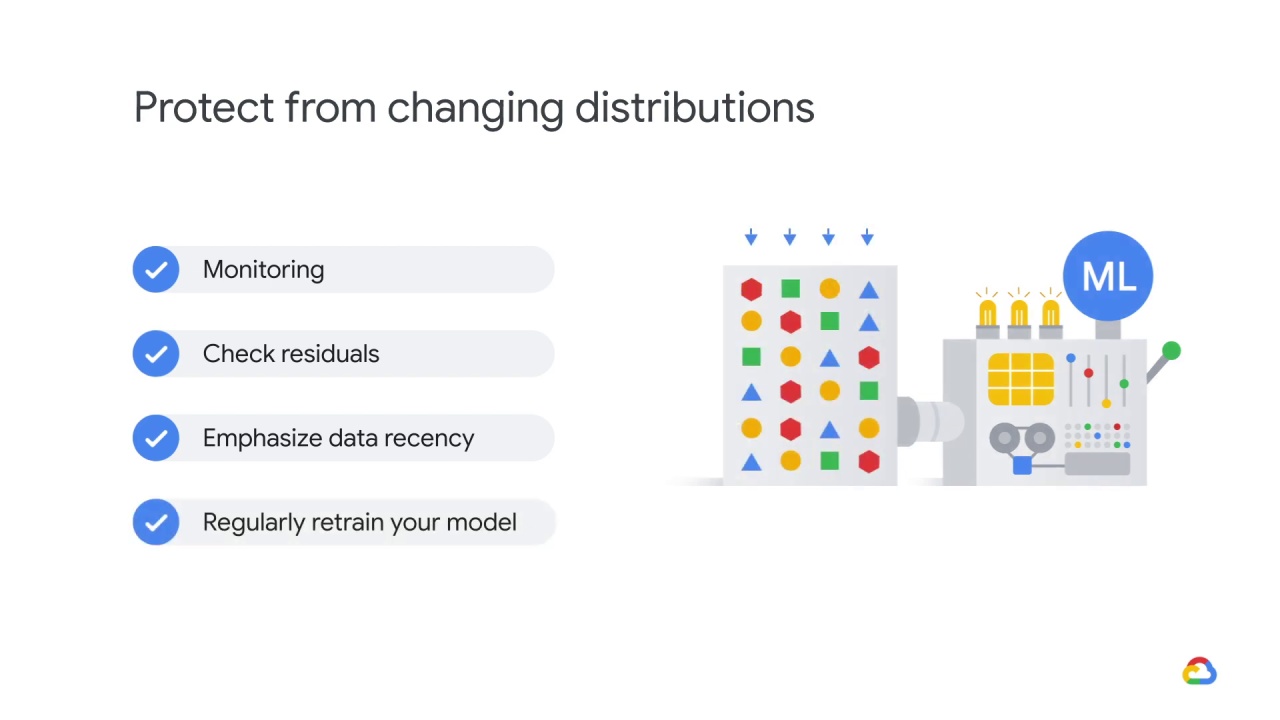
or by retraining the model on the most recent data.